
Image source: The Motley Fool.
Focus Financial Partners Inc (NASDAQ:FOCS)FY 2019 Earnings Conference CallMarch 06, 2019, 11:35 a.m. ET
Contents: Prepared Remarks Questions and Answers Call Participants Prepared Remarks:
Operator
Good morning. At this time, I would like to welcome everyone to the Focus Financial Partners Fourth Quarter and Full Year 2018 Earnings Teleconference. Our host for today's call will be Founder and Chief Executive Officer, Rudy Adolf, Chief Financial Officer, Jim Shanahan and General Counsel, Rusty McGranahan.
(Operator Instructions)
And as a reminder, today's conference call is being recorded. I would now like to turn the conference over to Mr. McGranahan. You may begin the conference.
J. Russell McGranahan -- General Counsel
Thank you and good morning everyone. I'm Rusty McGranahan, the General Counsel of Focus Financial Partners. Before we begin, let me remind you that during the course of this call, we may make a number of forward-looking statements. We call your attention to the fact that Focus results may of course differ from these statements. These statements are based on assumptions made by and information currently available to Focus Financial Partners and involve risks and uncertainties that could cause the results of Focus to materially differ from these statements. Focus has made filings with the SEC, which lists some of the factors that may cause its results to differ materially from these statements. And finally, Focus assumes no duty and does not undertake to update any such forward-looking statements.
With that, I will turn it over to our Founder and CEO, Rudy Adolf.
Ruediger Adolf -- Founder, Chief Executive Officer & Chairman
Thank you, Rusty. Good morning everyone and thank you for joining us. We appreciate your interest in Focus. On today's call, there are three key takeaways, I want to highlight.
First, as you saw from our release earlier today, Focus ended 2018 on a strong note, capping a very successful year. Our revenues grew more than 37% year-over-year, including 13% of organic growth. And our adjusted net income per share increased nearly 44% for the same period. These results substantially exceeded our objectives of 20% annual growth for each. Our annualized fourth quarter 2018 revenues are approaching $1 billion. Reaching this revenue level is an important inflection point in the evolution of our firms.
We not only achieved financial performance that exceeded our targets, but we also made significant progress against our strategy to increase our presence in the high net worths and ultra-high net worths markets. Our partner firms, primarily service to high net worths and ultra-highs net worths clients, an attractive segment of the market because of their relative resistance through economic cycles. Hence, they use of a wide range of services. This creates a very robust level of client retention and recurring revenue.
Last year, we completed eight holding company deals and 17 mergers by our partner firms, including some of the largest deals in our history, deepening our presence in those markets. In addition, we've provided tremendous value to our partners through our intellectual and financial resources. We also completed our IPO, creating permanent capital to invest in our business, and we further improved our balance sheet flexibility. Our business has never been stronger and I'm very pleased with how well we are positioned to grow in 2019.
Second, our target market is large and rapidly consolidating in the US and international. Fiduciary advice is winning in the wealth management marketplace, driven by client and advisor preferences, and strongly supported by regulators. In the US, market consolidation has accelerated, which plays to our strengths.
And third, our business model remains highly differentiated. Very simply, there is no other firm that offers what we do. The hallmark of our business model, fiduciary advice, entrepreneurship, access to cost-efficient capital and value-added services are what differentiates us in attracting new, like-minded partners. The network and scale benefits are real. Every new partner firm and every merger that an existing partner firm completes increases our capabilities, widens our industry reach and further validates our business model, which in turn accelerates our growth and access to future opportunities.
I would like to take a moment and update you on how the market opportunity has further evolved, since our IPO, and how our business model will enable us to capitalize on that opportunity. We believe that there are three important elements to focus on.
First, the market for fiduciary advice is large and continues to grow. RIAs and hybrids managed $4.7 trillion in client assets, about one quarter of total advisor-managed assets. Today, there are almost 1,000 RIAs, each managing assets of over $1 billion and a total of 17,000 RIA firms in the US. These fiduciary advice providers are increasingly preferred by clients and advisors alike, and are projected to increase their market share to 29% of advisor-managed assets by 2022 of $1.44 trillion (ph).
We are a beneficiary of this growth, both through the partner firms we acquired and through the acquisitions those firms make to scale their businesses. We provide these industry numbers, not just because they are interesting, but because they underline the confidence we have in our ability to achieve our 2020 target over multiple years. The growth and size of the industry is a major reason why 2018 was a record year for us, and we believe the first of many.
Second, industry observers believe that current M&A volume is half or less of what it could be, given the industry size, current fragmentation and the aging of advisors. With half of all managed assets in the hands of advisors, who are at least 55 years old, our support of inter-generational transfer of RIAs is a substantial future growth opportunity. Indeed, within the succession planning services we offer and our excellent track record of acquiring RIAs, we are uniquely positioned to capitalize on this opportunity.
Our ability to scale our partners through acquisitions is a core competency. As of year-end, we had 58 partner firms and have facilitated close to 100 tuck-in acquisitions for their M&A capability that approximately 40% of our partners have utilized to-date. This percentage increases, the longer firms have been with Focus, with more than half of firms that have been with Focus for at least two years, having completed mergers. This demonstrates the additional merger potential embedded in our recent direct acquisitions.
Third, we continue to benefit from powerful technology trends that are changing the way clients and advisors interact, but we never saw a threat from the much-hyped robo-advisor model. Technology is an important enabler of our partner firms' business models. In the last five years alone, an array of innovative, flexible, efficient and highly functional solutions has emerged that our partners and their clients benefit from.
Within Focus' scale, we have the benefit of being a major client of many small innovative technology providers as well as the leading custodians, influencing the development programs as well as benefiting from attractive pricing and service levels, which we can pass along to our partner firms, in turn, increasing their operational efficiency and profitability. Our partners benefit from our intellectual and financial resources, operating in a scaled business model with aligned interest, while retaining their entrepreneurial culture and independence. You have probably heard me say this before and I will continue to do so because it is at the core of what we do. We believe that the best model in wealth management is fiduciary advice, delivered by nimble and close-to-the-client entrepreneurs with their teams. As such, Focus never turns entrepreneurs into employees.
One of the most common questions we hear is, how have you continued to add partners and achieved this kind of growth despite the kind of volatility we experienced in the equity markets during the first quarter? While downward pressure on the equity markets happens from time to time, it actually reinforces the value of our partners delivered to their clients. It is during volatile markets that good advice is most valuable to them. We have seen no impact from market volatility to-date in our acquisition pipeline, which as I have mentioned is as robust as we have ever seen. Our partner client base is primarily high net worths and ultra-high net worths individuals or families. These client groups tend to be disciplined and informed, and have confidence in their advisors and wealth strategists. And therefore are the most loyal client base in the wealth management industry.
Our partner firms do not manage assets against the performance of a particular benchmark like asset managers. They provide holistic advice on everything from financial planning to major life events impacting their family. Yes, they manage equities, but they also manage an array of other assets that are not correlated to the equity markets. And they often serve multiple generations.
Now, I would like to briefly touch on our international expansion. As we have discussed previously, we anticipated that our IPO would create more opportunities for us, including international. Our initial areas of focus are Canada, Australia and the UK. We recently announced the closing of a new partner firm, Prime Quadrant, a Toronto-based wealth management firm. This is our second partner firm in Canada and is an important transaction as Prime Quadrant serves ultra-high net worths families and individuals.
Equally important, our work, exploring the Australian market is showing excellent results. This week, we announced that we signed a definitive agreement with Escala Partners, one of the leading Australian ultra-high net worth firms. This transaction is expected to close in the second quarter of this year. Australia is one of the largest wealth management markets in the world outside of the US, and we are pleased with how our model is resonating with highly sophisticated traders there. We see our international expansion as an important component of our growth strategy, while further enhancing our diversification. Many markets are experiencing regulatory change that is elevating the standards of advice and challenging the incumbent models. We have been exploring and building relationships in these markets, and they present an excellent growth opportunity for Focus.
Our momentum in 2019 has already been significant. Year-to-date, we have closed on two new partner firms, AG&S and Prime Quadrant, with total acquired base earnings of approximately $8.5 million, and have three pending partner firm acquisitions with total acquired base earnings of approximately $9.7 million that we expect to close in the first half of this year. These firms are Lanham O'Dell & Company, Foster Dykema Cabot and Escala Partners. The combination of these direct deals will be mid-single digit accretive to our adjusted net income per share.
On the merger side, as mentioned, this is akin to recruiting for traditional players and the nature of Focus value adds to our partners. In the first quarter of 2019, we are proud to have already closed seven mergers and announced four additional deals that are expected to close in the first half of 2019. We believe that the strength of our pipeline will drive strong momentum through the rest of the year.
Our priorities for 2019 are clear. First, we will further evolve the support we provide to our partners with value-added initiatives across key components of the business system. Operations, technology, marketing, HR management and leadership development, compliance, cybersecurity and legal support are all areas of critical importance. It is our scale and breadth that enables us to be on the leading edge of these areas and creates terrific incremental opportunities to grow our business.
Second, we will capitalize on the plethora of attractive merger opportunities for many of our partners. Matching, prioritizing and facilitating these mergers, is a core objective of our team and also a substantial growth opportunity.
Third, in the US, we plan to expand our portfolio through our partner firms, particularly in the high net worths and ultra-high net worths segments, adding further breadths and depths to our partner network. Our focus will remain on established profitable RIAs and multi-family offices with a proven track record of client service. In the breakaway segment, we will continue to focus on elite teams only.
Fourth, outside of the US, our primary emphasis will be on Australia and Canada. We also monitor in selected European markets and Southeast Asia, which is a natural extension of our involvement in Australia.
Five, we are testing additional value-added services through our partners, like our recent investment in SmartAsset, one of the leading client lead generators in the industry. We're also exploring new ultra-high net worths sectors. For example, we are interested in more deeply penetrating the artists, entertainers and athletes' client vertical. This growth market is uncorrelated to our other businesses and we have built an excellent foundation in the space over the last three years.
As such, for the remainder of 2019, our outlook is very positive. And we believe, we are in the right place, at the right time to take advantage of this secular shifts in our industry. We have a strong execution-oriented team in place, and we are fully focused on delivering against our strategic priorities. We believe that the steps we are taking to build upon our highly differentiated business model will continue to drive sustained revenue and adjusted net income per share growth in excess of our targets.
Before turning the call over to Jim, I wanted to update you on the latest addition to the Focus team. Tina Madon has just joined us and will lead our Investor Relations and Corporate Communications efforts. We are very happy to have her and confident that she will help us further develop our relationships with the investor community and media.
Now, I will hand the call over to Jim for a more detailed review of our fourth quarter and full year financials. Jim?
James Shanahan -- Chief Financial Officer
Thank you, Rudy and good morning everyone.
First, I would like to offer a few comments on the format of our financial presentation. The financial statements and other GAAP disclosures contained in our press release include the results of Focus Financial Partners Inc., which is the public company and those of Focus Financial Partners LLC, of which Focus Financial Partners Inc. became the managing member and owner of the majority of the outstanding membership interest in a series of reorganization transactions that were completed on July 30, 2018 in connection with our IPO.
As previously mentioned, Focus made a decision to go public for three reasons. First, access to public currency; second, efficiency and flexibility of funding options; and third, the credibility of being a public company. It has only been a little over six months since our IPO, and we are seeing the initial benefits of this important step.
Our fourth quarter results represents a record financial performance for our business. With regard to our revenues in the quarter, I would like to highlight the following. Total revenues were $247.5 million in Q4 2018, an increase of $57.7 million or 30.4% compared to Q4 2017. Wealth management fees increased $53.2 million in Q4 2018 or 29.7% from Q4 2017. Wealth management fees represents 93.8% of our Q4 aggregate revenues. Approximately $37.4 million of the revenue growth during the quarter was the result of new partner firm acquisitions completed after the fourth quarter of 2017. Revenues were primarily driven from domestic partner firms, which accounted for 98% of our Q4 revenues. Our fee-based and recurring revenues were in excess of 95% of our total revenues, and we expect this trend to continue. We believe these revenue characteristics are rarely seen in the financial service industry, and they demonstrate the strength and enduring nature of our business model.
Our 2018 full year organic revenue growth was 13%. Our 2018 fourth quarter organic revenue growth was 10.7% and included one month from the Loring Ward merger, which closed November 30, 2018. In 2019, we estimate Loring Ward will contribute at least $50 million to aggregate company revenues. We are excited about the recently completed Dan Goldie RIA transaction on February 1, 2019. Dan Goldie was one of Loring Ward's largest clients and supports our investment thesis that a number of TAMP clients of Loring Ward will convert to our Buckingham RIA business over time. In short, our TAMP business provides an excellent pipeline of potential merger opportunities.
As Rudy mentioned, we have closed or signed 16 acquisitions and mergers to-date in 2019. We expect to achieve year-over-year organic revenue growth of at least 10% for full year 2019.
As a reminder, a portion of our total revenues are not correlated to the financial markets. For Q4 2018, we estimate this percentage was approximately 23% of total revenues. Of the estimated 77% of revenue that was correlated to financial markets, we estimate 73% was generated from advanced billings. Our partner firm billing methodologies are highly diversified and can be billed monthly, quarterly or semiannually, and vary from partner firm to partner firm, but advanced billings are generally calendar quarterly and advance. Accordingly, we expect that our Q1 2019 total revenues will be moderately impacted by these advanced billings, due to the market decline experienced at the end of 2018.
Additionally, a component of our wealth management services are tax and related service projects. Based on the timing of certain tax and related service projects that certain of our partner firms complete on behalf of their clients, we estimate that our 2019 Q1 and Q4 revenues may be marginally impacted by approximately $3 million to $5 million, when compared to 2019 Q2 and Q3 revenues.
Regarding expenses, we remain committed to actively managing our expense base. As we have discussed in the past, our largest expenses are management fees and employee compensation or related benefits. Management fees are formulaic, variable and a product of the earn-ins of our partner firms. Our expenses are stable and correlated to our revenues. Our EBITDA margin over the last three years has been consistent, ranging from 21% to 22%. It's important to note that our EBITDA margin is primarily driven by the percentage EBITDA acquired in our transactions.
Income from operations was $34.4 million for Q4 2018 as compared to $2.9 million for Q4 2017. As presented in our consolidated statement of operations, the fourth quarter of 2018 was impacted by $22.2 million of non-cash charges and the fair value of estimated earn-outs. As a reminder, partner firm earn-outs generally occur over a six-year period.
On the US GAAP, we are required to measure these contingent liabilities each quarter using Monte Carlo simulations. The market decline experienced in December 2018 drove a reduction in the estimate of these liabilities as of December 31. When markets increase, the estimate of these liabilities typically increase. Interest expense for the quarter was $11 million compared to $14.5 million in the fourth quarter of 2017.
In connection with our IPO, we repaid the $207 million second lien term-loan outstanding, and we paid down the first lien term-loan by $185.5 million.
Our fourth quarter GAAP net income was $17.5 million compared to a net loss of $9.7 million in the 2017 fourth quarter. For the three months ended December 31, 2018, our adjusted net income per share was $0.51 per share. As a reminder, the share count for our EPS calculations can fluctuate based on our quarter-end share price, which is used to calculate common stock equivalents for incentive units outstanding at the Focus LLC level. We included a table of our outstanding incentive units and their respective hurdle rates as of December 31, 2018 in our earnings release. We also included a table of the ownership interest in Focus Financial Partners LLC, including their non-controlling interest as of December 31, 2018.
Regarding share count, we do not anticipate any equity issuance in connection with our 2019 first quarter acquisition activity, which we expect to fund with cash on-hand and from revolver borrowings. However, we will evaluate equity consideration, where appropriate, in connection with our growing acquisition pipeline.
Now shifting to our balance sheet. As of December 31, 2018, we had cash and cash equivalents of $33.2 million compared to $51.5 million at December 31, 2017. We had approximately $839 million outstanding on our credit facilities compared to $1 billion as of December 31, 2017. The outstanding amounts on our credit facility were comprised of $799 million of term-loan borrowings and $40 million of revolver borrowings. Our revolver has a $650 million facility size, which will be primarily used for acquisition activity.
At December 31, 2018, our net leverage ratio under our credit facility was 3.
 Don't look now, but the alternative energy market has changed dramatically.
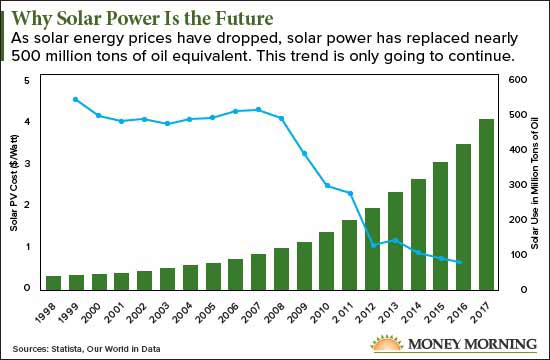
 system is well aware of this.
 Ralph Orlowski | Bloomberg | Getty Images Statues of a bull and a bear outside the Frankfurt Stock Exchange
  Getty Images A trader reacts to the Flash Crash on May 6, 2010.
  ChinaFotoPress | Getty Images
  Getty Images

 Post to FacebookPosted!
 On average, Americans owe $6,354 on bank-issued credit cards. At the state level, average credit card debt per capita varies substantially. 24/7 Wall St. reviewed the average bank card balance from creditcards.com to identify the states with the most credit card debt. SIphotography / Getty ImagesFullscreen
 1. Alaska• Average credit card balance: $8,515• Cost of living: 5.4 percent more than Average• Average credit score: 668• Average number of cards: 2.9 Chilkoot / Getty ImagesFullscreen
 2. Connecticut• Average credit card balance: $7,258• Cost of living: 8.7 percent more than Average• Average credit score: 690• Average number of cards: 3.2 SeanPavonePhoto / Getty ImagesFullscreen
 3. Virginia• Average credit card balance: $7,161• Cost of living: 2.3 percent more than Average• Average credit score: 680• Average number of cards: 3.1 SeanPavonePhoto / Getty ImagesFullscreen
 4. New Jersey• Average credit card balance: $7,151• Cost of living: 13.2 percent more than Average• Average credit score: 686• Average number of cards: 3.5 SeanPavonePhoto / Getty ImagesFullscreen
 5. Maryland• Average credit card balance: $7,043• Cost of living: 9.5 percent more than Average• Average credit score: 672• Average number of cards: 3.2 SeanPavonePhoto / Getty ImagesFullscreen
 6. Hawaii• Average credit card balance: $6,981• Cost of living: 18.4 percent more than Average• Average credit score: 693• Average number of cards: 3.3 Eric Tessmer / Wikimedia CommonsFullscreen
 7. Texas• Average credit card balance: $6,902• Cost of living: 3.1 percent less than Average• Average credit score: 656• Average number of cards: 3.1 RoschetzkyIstockPhoto / Getty ImagesFullscreen
 8. Colorado• Average credit card balance: $6,718• Cost of living: 3 percent more than Average• Average credit score: 688• Average number of cards: 3.1 f11photo / Getty ImagesFullscreen
 9. Georgia• Average credit card balance: $6,675• Cost of living: 7.9 percent less than Average• Average credit score: 654• Average number of cards: 3.0 Sean Pavone / Getty ImagesFullscreen
 10. New York• Average credit card balance: $6,671 • Cost of living: 15.6 percent more than Average • Average credit score: 688 • Average number of cards: 3.3 Terabass / Wikimedia CommonsFullscreen
 11. Washington• Average credit card balance: $6,592• Cost of living: 5.5 percent more than Average• Average credit score: 693• Average number of cards: 3.0 evenfh / Shutterstock.comFullscreen
 12. New Hampshire• Average credit card balance: $6,490• Cost of living: 5.9 percent more than Average• Average credit score: 701• Average number of cards: 3.1 Sean Pavone / Getty ImagesFullscreen
 13. California• Average credit card balance: $6,481• Cost of living: 14.4 percent more than Average• Average credit score: 680• Average number of cards: 3.2 Art Wager / Getty ImagesFullscreen
 14. Illinois• Average credit card balance: $6,410• Cost of living: 1.1 percent less than Average• Average credit score: 683• Average number of cards: 3.1 lhongfoto / Getty ImagesFullscreen
 15. Nevada• Average credit card balance: $6,401• Cost of living: 2.6 percent less than Average• Average credit score: 655• Average number of cards: 3.2 f11photo / Getty ImagesFullscreen
 16. Arizona• Average credit card balance: $6,389• Cost of living: 4.1 percent less than Average• Average credit score: 669• Average number of cards: 3.0 Zereshk / Wikimedia CommonsFullscreen
 17. Florida• Average credit card balance: $6,388• Cost of living: 0.3 percent less than Average• Average credit score: 668• Average number of cards: 3.2 Sean Pavone / Getty ImagesFullscreen
 18. Rhode Island• Average credit card balance: $6,375• Cost of living: 0.4 percent less than Average• Average credit score: 687• Average number of cards: 3.3 SeanPavonePhoto / Getty ImagesFullscreen
 19. Delaware• Average credit card balance: $6,366• Cost of living: 0.2 percent more than Average• Average credit score: 672• Average number of cards: 3.1 DenisTangneyJr / Getty ImagesFullscreen
 20. Massachusetts• Average credit card balance: $6,327• Cost of living: 7.8 percent more than Average• Average credit score: 699• Average number of cards: 3.2 Sean Pavone / Getty ImagesFullscreen
 21. New Mexico• Average credit card balance: $6,317• Cost of living: 6.4 percent less than Average• Average credit score: 659• Average number of cards: 2.8 DenisTangneyJr / Getty ImagesFullscreen
 22. Oklahoma• Average credit card balance: $6,296• Cost of living: 11 percent less than Average• Average credit score: 656• Average number of cards: 2.7 Majestic_Aerials / Getty ImagesFullscreen
 23. Wyoming• Average credit card balance: $6,245• Cost of living: 3.3 percent less than Average• Average credit score: 678• Average number of cards: 2.8 undefined undefined / Getty ImagesFullscreen
 24. South Carolina• Average credit card balance: $6,157• Cost of living: 9.7 percent less than Average• Average credit score: 657• Average number of cards: 2.9 Sean Pavone / Getty ImagesFullscreen
 25. Pennsylvania• Average credit card balance: $6,146• Cost of living: 1.6 percent less than Average• Average credit score: 687• Average number of cards: 3.1 f11photo / Getty ImagesFullscreen
 26. North Carolina• Average credit card balance: $6,117• Cost of living: 9.1 percent less than Average• Average credit score: 666• Average number of cards: 3.0 Sean Pavone / Getty ImagesFullscreen
 27. Kansas• Average credit card balance: $6,082• Cost of living: 9.5 percent less than Average• Average credit score: 680• Average number of cards: 2.8 ricardoreitmeyer / Getty ImagesFullscreen
 28. Louisiana• Average credit card balance: $6,074• Cost of living: 9.6 percent less than Average• Average credit score: 650• Average number of cards: 2.8 GregJK / Getty ImagesFullscreen
 29. Oregon• Average credit card balance: $6,012• Cost of living: 0.2 percent less than Average• Average credit score: 688• Average number of cards: 3.0 4nadia / Getty ImagesFullscreen
 30. Tennessee• Average credit card balance: $5,975• Cost of living: 9.8 percent less than Average• Average credit score: 662• Average number of cards: 2.8 SeanPavonePhoto / Getty ImagesFullscreen
 31. Alabama• Average credit card balance: $5,961• Cost of living: 13.4 percent less than Average• Average credit score: 654• Average number of cards: 2.7 SeanPavonePhoto / Getty ImagesFullscreen
 32. Utah• Average credit card balance: $5,960• Cost of living: 2.7 percent less than Average• Average credit score: 683• Average number of cards: 3.0 johnnya123 / Getty ImagesFullscreen
 33. Vermont• Average credit card balance: $5,924• Cost of living: 1.6 percent more than Average• Average credit score: 702• Average number of cards: 2.9 Sean Pavone / Getty ImagesFullscreen
 34. Minnesota• Average credit card balance: $5,911• Cost of living: 2.5 percent less than Average• Average credit score: 709• Average number of cards: 3.0 RudyBalasko / Getty ImagesFullscreen
 35. Missouri• Average credit card balance: $5,897• Cost of living: 10.5 percent less than Average• Average credit score: 675• Average number of cards: 2.9 f11photo / Getty ImagesFullscreen
 36. Montana• Average credit card balance: $5,845• Cost of living: 5.9 percent less than Average• Average credit score: 689• Average number of cards: 2.9 TheBigMK / Getty ImagesFullscreen
 37. Ohio• Average credit card balance: $5,843• Cost of living: 10.7 percent less than Average• Average credit score: 678• Average number of cards: 3.0 Sean Pavone / Getty ImagesFullscreen
 38. Idaho• Average credit card balance: $5,817• Cost of living: 7 percent less than Average• Average credit score: 681• Average number of cards: 2.9 knowlesgallery / Getty ImagesFullscreen
 39. Maine• Average credit card balance: $5,784• Cost of living: 1.6 percent less than Average• Average credit score: 689• Average number of cards: 2.9 SeanPavonePhoto / Getty ImagesFullscreen
 40. South Dakota• Average credit card balance: $5,692• Cost of living: 11.7 percent less than Average• Average credit score: 700• Average number of cards: 2.8 EunikaSopotnicka / Getty ImagesFullscreen
 41. Arkansas• Average credit card balance: $5,660• Cost of living: 13.1 percent less than Average• Average credit score: 657• Average number of cards: 2.8 Belinda Hankins Miller from U.S.A., upload by Herrick 10:33, 15 November 2007 (UTC) / Wikimedia CommonsFullscreen
 42. Nebraska• Average credit card balance: $5,630• Cost of living: 9.5 percent less than Average• Average credit score: 695• Average number of cards: 2.8 ChrisBoswell / Getty ImagesFullscreen
 43. Michigan• Average credit card balance: $5,622 • Cost of living: 6.7 percent less than Average • Average credit score: 677 • Average number of cards: 2.9 pawel.gaul / Getty ImagesFullscreen
 44. Indiana• Average credit card balance: $5,581• Cost of living: 9.7 percent less than Average• Average credit score: 667• Average number of cards: 2.8 f11photo / Getty ImagesFullscreen