Wednesday, April 30, 2014

Energizer: Faster, Bunny, Faster!

Energizer (ENR) reported earnings today, but who cares about financial results when you’ve decided to split in two?

Associated Press

And that’s exactly what Energizer has decided to do. Citigroup’s Wendy Nicholson and Beth Kite note that the quarter doesn’t “reflect great fundamentals” but the split-up is “great for the stock.” She explains:

We're pleased ENR reconfirmed guidance, as while the pressure to batteries sales accelerated in the quarter, the restructuring program is once-again tracking ahead of plan. ENR has banked $96 mm in restructuring savings YTD, such that it upwardly revised its FY14 savings goal to $100-$125 mm from $100 mm, previously. Clearly, today's results pale in comparison to the news that the company is splitting its Household Products and Personal Care segments into two stand-alone businesses. We were surprised and we think investors are likely surprised by this news, as ENR's management has repeatedly said they think the businesses create the most value under one company.

Shares of Energizer have jumped 15% to $112.37 at 10:24 a.m. today, while Spectrum Brands (SPB) has risen 1.4% to $76.88 and Kimberly Clark (KMB) has gained 1% to $112.14.

Tuesday, April 29, 2014

Middleby Down to Buy - Analyst Blog

Zacks Investment Research downgraded The Middleby Corporation (MIDD) to a Zacks Rank #2 (Buy) from a Zacks Rank #1 (Strong Buy) on Jul 12 based on the company's operations in Europe, which is still expected to face a difficult economic scenario ahead.

Why the Downgrade?

The company's operations in Europe generate substantial revenues. However, per the company, the economic situation in the region will take sometime to revive. Moreover, the overseas operations of Middleby expose it to foreign currency exchange risks.

Middleby recorded strong results in the first quarter of 2013 with adjusted earnings of $1.65, increasing 37.5% year over year. Revenues for the quarter jumped 43.1% year over year to $327.5 million, primarily led by the Viking acquisition, completed in late December last year.

Viking contributed roughly $58.7 million to the total revenue in the quarter with the total revenue from acquisitions going up to $74.0 million. Apart from Viking, Middleby undertook many acquisitions in the recent past, effectively implementing the company's strategies to grow inorganically.

The company has been expanding geographically too. In the reported quarter, Middleby witnessed a 20% hike in revenues from Latin America, the Middle East and Asia. Management also expects that the above regions will continue to show signs of prosperity along with several other emerging markets.

Middleby has been introducing products and technologies, with a view to achieving a greater market share. The company's Kitchen of the Future is expected to be an instant hit with consumers and will be helpful in increasing the revenues. It is expected that after the launch of 12 products in 2012, Middleby will launch around 13 products in 2013.

Other Stocks to Consider

The following machinery stocks with favorable Zacks Rank are performing well and are worth considering.

Lincoln Electric Holdings Inc. (LECO) carries a Zacks Rank #1 (Strong Buy) Chart Industr! ies Inc. (GTLS) carries a Zacks Rank #2 (Buy) Key Technology, Inc. (KTEC) carries a Zacks Rank #2 (Buy).

Monday, April 28, 2014

Netflix's Growth Story Is Not Over

Brett Icahn and fund co-manager David Schechter are of the opinion that Netflix (NFLX) can rise further as it accelerates its global expansion. Carl Icahn (Trades, Portfolio) has stated that he cut his Netflix position because it had become too big.The claims of Icahn Jr. and Schechter also deserve a closer look, as despite trading at a P/E of more than 400 both are bullish on the company. It looks like that the two of them are analyzing Netflix along the same lines as MKM Partners, which had upgraded Netflix's price target from $285 to $370 last year and stated that its market cap could reach a whopping $75 billion by 2020.In my opinion, MKM's valuation, although wildly positive, shouldn't be ruled out. Even if the company couldn't achieve the projected $75 billion in market cap, it should get close to the figure. The reasons behind this bullish thesis aren't hard to find. First, according to MKM analyst Rob Sanderson, the video streaming market in the U.S. is worth $200 billion and Netflix's trailing twelve months' revenue is only $4.14 billion. This means that Netflix has a lot of room to grow revenue.What would drive growth?The company has been adding subscribers at a pretty good rate. It saw an addition of 1.3 million new subscribers in the U.S. in the previous quarter, near the higher end of its guidance of 690,000-1.49 million. More impressively, Netflix's international subscribers jumped a whopping 1.44 million. In this way, Netflix ended the quarter with more than 40 million subscribers.The company's strategy of making its original content along with carrying content from other studios has worked well. This helped Netflix bring in revenue of $1.1 billion, at par with estimates, while earnings of 52 cents per share were well ahead of the 49 cents consensus.Netflix has now overtaken HBO in terms of subscribers as it aims to become a web-based television network. It is reportedly engaged in negotiations with U.S. cable TV providers such as Suddenlink Communications, Cox Communications, RCN Tele! com Services, and Atlantic Broadband Finance for content. If Netflix succeeds in getting itself onto cable networks and is integrated into set-top boxes, its usage would most probably increase.A big marketEven MKM Partners' analysis suggests that the "economics of entertainment video will be redistributed with the shift to Internet-delivered services." That's probably the reason why Netflix's partnership with cable operators such as Virgin in the U.K. and ComHem in Sweden could turn out to be lucrative. Sanderson states that cable operators in the U.K. view Netflix as a "must-have" service, and as the company moves into other international markets in the future, its international subscriber count can exceed its U.S. subscriber base.In countries such as India, where broadband penetration is still low, Netflix can find a big market. The number of households with a TV in the country is projected to multiply from around 160 million at present to 200 million in the next four years. This growth will be driven by an increase in cable digitization and direct-to-home services. Penetration in such mass markets could be a big boon for Netflix and help it grow its revenue substantially.Analysts are also bullish about the company's prospects with as many as 12 brokerages raising their price targets on the stock. Analysts at Morgan Stanley expect Netflix to add 4.2 million subscribers in the fourth quarter. Looking forward, CEO Reed Hastings is of the opinion that Netflix can reach 60 million to 90 million subscribers internationally in the future.ConclusionNetflix has a big playing field ahead of it and it isn't hard to see why Brett Icahn and Schechter are still bullish. As I said above, Netflix might not be worth $75 billion by 2020 as MKM suggests, but it can surely continue growing as it taps into more markets and expands its wings.

Currently 0.00/512345

Top Industrial Disributor Companies To Watch In Right Now

Rating: 0.0/5 (0 votes)

Email FeedsSubscribe via Email RSS FeedsSubscribe RSS Comments Please leave your comment:
More GuruFocus Links
Latest Guru Picks Value Strategies
Warren Buffett Portfolio Ben Graham Net-Net
Real Time Picks Buffett-Munger Screener
Aggregated Portfolio Undervalued Predictable
ETFs, Options Low P/S Companies
Insider Trends 10-Year Financials
52-Week Lows Interactive Charts
Model Portfolios DCF Calculator
RSS Feed Monthly Newsletters
The All-In-One Screener Portfolio Tracking Tool
iPhone App MORE GURUFOCUS LINKS
Latest Guru Picks Value Strategies
Warren Buffett Portfolio Ben Graham Net-Net
Real Time Picks Buffett-Munger Screener
Aggregated Portfolio Undervalued Predictable
ETFs, Options Low P/S Companies
Insider Trends 10-Year Financials
52-Week Lows Interactive Charts
Model Portfolios DCF Calculator
RSS Feed Monthly Newsletters
The All-In-One Screener Portfolio Tracking Tool
NFLX STOCK PRICE CHART 322.08 (1y: +50%) $(function(){var seriesOptions=[],yAxisOptions=[],name='NFLX',display='';Highcharts.setOptions({global:{useUTC:true}});var d=new Date();$current_day=d.getDay();if($current_day==5||$current_day==0||$current_day==6){day=4;}else{day=7;} seriesOptions[0]={id:name,animation:false,color:'#4572A7',lineWidth:1,name:name.toUpperCase()+' stock price',threshold:null,data:[[1367211600000,215.013],[1367298000000,216.07],[1367384400000,212.91],[1367470800000,214.49],[1367557200000,213.45],[1367816400000,210.69],[1367902800000,206.25],[1367989200000,208.61],[1368075600000,216.41],[1368162000000,217.694],[1368421200000,229.379],[1368507600000,233.97],[1368594000000,243.4],[1368680400000,237.03],[1368766800000,239],[1369026000000,239.55],[1369112400000,237.09],[1369198800000,228.56],[1369285200000,226.18],[1369371600000,228.74],[1369717200000,214.19],[1369803600000,215.34],[1369890000000,222.66],[1369976400000,226.25],[1370235600000,221.97],[1370322000000,225.31],[1370408400000,223.46],[1370494800000,217.74],[1370581200000,220.22],[1370840400000,220.93],[1370926800000,214.46],[1371013200000,207.64],[1371099600000,215.39],[1371186000000,213.99],[1371445200000,229.23],[1371531600000,228.83],[1371618000000,232.31],[1371704400000,223.52],[1371790800000,216.9],[1372050000000,215.6],[1372136400000,212.9],[1372222800000,212.1],[1372309200000,214.97],[1372395600000,211.09],[1372654800000,224.28],[1372741200000,221.46],[1372827600000,220.91],[1373000400000,225.1],[1373259600000,233.1],[1373346000000,247.382],[1373432400000,243.82],[1373518800000,244.17],[1373605200000,257.261],[1373864400000,257.98],[1373950800000,260.48],[1374037200000,267.92],[1374123600000,266.41],[1374210000000,264.576],[1374469200000,261.96],[1374555600000,250.26],[1374642000000,241.3],[1374728400000,246.74],[1374814800000,246.31],[1375074000000,244.96],[1375160400000,243.76],[1375246800000,244.484],[1375333200000,249.12],[1375419600000,246.18],[1375678800000,253.84],[1375765200000,255.9],[1375851600000,249.21],[1375938000000,250.4],[1376024400000,252.75],[1376283600000,256.6],[1376370000000,259.19],[1376456400000,261.81],[1376542800000,253.41],[1376629200000,258.87],[1376888400000,259.78],[1376974800000,273.29],[1377061200000,270.37],[1377147600000,269.75],[1377234000000,278.36],[137749! 3200000,282.72],[1377579600000,276.04],[1377666000000,283.36],[1377752400000,287.85],[1377838800000,283.91],[1378184400000,289],[1378270800000,292.43],[1378357200000,295.11],[1378443600000,291.54],[1378702800000,294.15],[1378789200000,313.06],[1378875600000,308.3],[1378962000000,301.406],[1379048400000,305.65],[1379307600000,302.16],[1379394000000,299.55],[1379480400000,306.92],[1379566800000,305.498],[1379653200000,313.83],[1379912400000,302.04],[1379998800000,306.49],[1380085200000,307.14],[1380171600000,313.51],[1380258000000,312.4],[1380517200000,309.21],[1380603600000,324.62],[1380690000000,330.73],[1380776400000,321.72],[1380862800000,327.26],[1381122000000,318.16],[1381208400000,302.32],[1381294800000,288.43],[1381381200000,303.994],[1381467600000,300.848],[1381726800000,324.36],[1381813200000,321.69],[1381899600000,322.878],[1381986000000,330.1],[1382072400000,333.5],[1382331600000,354.99],[1382418000000,322.524],[1382504400000,330.24],[1382590800000,331.22],[1382677200000,328.031],[1382936400000,314],[1383022800000,327.3],[1383109200000,318.14],[1383195600000,322.48],[1383282000000,329.265],[1383544800000,337.6],[1383631200000,341.5],[1383717600000,335.63],[1383804000000,326.86],[1383890400000,334.9],[1384149600000,337.91],[1384236000000,333.73],[1384322400000,335.284],[1384408800000,342.57],[1384495200000,349.76],[1384754400000,341.77],[1384840800000,337.29],[1384927200000,339.52],[1385013600000,348.5],[1385100000000,347.85],[1385359200000,350.24],[1385445600000,355.2],[1385532000000,362.49],[1385704800000,365.8],[1385964000000,363.92],[1386050400000,362.94],[1386136800000,356.27],[1386223200000,358.06],[1386309600000,354.44],[1386568800000,355.67],[1386655200000,363.1],[1386741600000,363.98],[1386828000000,373.33],[1386914400000,368.97],[1387173600000,366.31],[1387260000000,374.87],[1387346400000,376.24],[1387432800000,376.74],[1387519200000,375.67],[1387778400000,380.58],[1387864800000,378.39],[1388037600000,376.93],[1388124000000,367.5],[1388383200000,366.99],[1388469600000,368.17],[1388642! 400000,36! 2.82],[1388728800000,363.1],[1388988000000,359.57],[1389074400000,339.5],[1389160800000,340.99],[1389247200000,337.05],[1389333600000,332.14],[1389592800000,336.81],[1389679200000,337.96],[1389765600000,330.38],[1389852000000,331.68],[1389938400000,330.04],[1390284000000,328.71],[1390370400000,333.73],[1390456800000,388.72],[1390543200000,386.08],[1390802400000,381.23],[1390888800000,406.77],[1390975200000,400.42],[1391061600000,404.67],[1391148000000,409.33],[1391407200000,404.38],[1391493600000,405.91],[1391580000000,404.42],[1391666400000,407.91],[1391752800000,429.98],[1392012000000,430.44],[1392098400000,433.99],[1392184800000,428.93],[1392271200000,436.55],[1392357600000,435.51],[1392703200000,436.85],[1392789600000,428.23],[1392876000000,434.95],[1392962400000,432.23],[1393221600000,447],[1393308000000,453.03],[1393394400000,448.79],[1393826400000,445.59],[1393912800000,454.98],[1393999200000,453.5],[1394085600000,450.51],[1394172000000,448.37],[1394427600000,439.95],[1394514000000,437.48],[1394600400000,436.58],[1394686800000,430.06],[1394773200000,424.49],[1395032400000,422.72],[1395118800000,420.25],[1395205200000,420.09],[1395291600000,424.27],[1395378000000,405.99],[1395637200000,378.9],[1395723600000,370.84],[1395810000000,372.28],[

Sunday, April 27, 2014

Apple Just Stunned Wall Street

Apple Inc. (Nasdaq: AAPL) pleasantly surprised Wall Street by comfortably beating expectations when it reported earnings for its March quarter after the market close today (Wednesday).

The Cupertino, Calif.-based tech giant also threw existing holders of Apple stock several goodies, including an expansion of the stock buyback program, a seven-for-one stock split, and an 8% increase in the dividend.

The Apple stock buyback program will expand by $30 billion, to bring the total by 2015 to $130 billion.

The raft of happy news sent AAPL stock up more than 8% in after-hours trading.

#symbols-c4ca4238a0b923820dcc509a6f75849b { width: 253px; font-family: Arial; font-size: 11px; color: #333333; } #symbols-c4ca4238a0b923820dcc509a6f75849b .header { float: left; font-family: Georgia; font-size: 14px; color: #456626; line-height: 14px; padding-left: 14px; font-weight: bold; } #symbols-c4ca4238a0b923820dcc509a6f75849b .date { float: right; padding-right: 32px; font-weight: bold; } #symbols-c4ca4238a0b923820dcc509a6f75849b .chart { font-family: Georgia; font-size: 12px; color: #456626; width: 253px; height: 135px; line-height: 135px; text-align: center; } #symbols-c4ca4238a0b923820dcc509a6f75849b ul { list-style: none; padding: 0; margin: 0; } #symbols-c4ca4238a0b923820dcc509a6f75849b li { padding: 0; margin: 0; } #symbols-c4ca4238a0b923820dcc509a6f75849b li:nth-child(odd) { background-color: #eeebe6; } #symbols-c4ca4238a0b923820dcc509a6f75849b .symbols-item .name { float: left; width: 100px; overflow: hidden; padding: 3px; } #symbols-c4ca4238a0b923820dcc509a6f75849b .symbols-item .price { float: left; width: 55px; overflow: hidden; padding: 3px; text-align: right; } #symbols-c4ca4238a0b923820dcc509a6f75849b .symbols-item .percent { float: left; width: 80px; overflow: hidden; padding: 3px; text-align: right; } #symbols-c4ca4238a0b923820dcc509a6f75849b .symbols-item.active { background-color: #456626; color: #ffffff; } #symbols-c4ca4238a0b923820dcc509a6f75849b .chart-container { width: 253px; height: 135px; padding: 0 0 5px 0; } #symbols-c4ca4238a0b923820dcc509a6f75849b .chart-container img { width: 253px; height: 135px; max-width: none; } .clear { clear: both; } Apple NASDAQ: AAPL Apr 25 loading chart... Price: 571.94 | Ch: 4.17 (0.7%)

Apple reported earnings per share of $11.62, a healthy $1.46 above the $10.16 analysts had forecast as well as the $10.09 reported in the same quarter a year ago.

Revenue was $45.6 billion, which was $2 billion above both the year-ago quarter and analyst expectations.

apple earningsAnother pleasant surprise was higher gross margins, which came in at 39.3%. That, too, beat the forecast of 37.7% as well as the year-ago quarter number of 37.5%.

The good news was almost entirely driven by surprisingly strong iPhone sales. Apple sold 43.7 million iPhones in the quarter, a 17% increase over the same quarter last year and far above the Street's number of 37.7 million.

That's a positive sign for the current quarter in that it shows demand for the iPhone remained high despite the lack of any updates and rumors of iPhone models with larger screens (a 4.7-inch and a 5.5-inch) expected to arrive in the fall.

The only other sector to shine in the March quarter was iTunes/Software and Services, which saw revenue rise 11% to nearly $4.6 billion.

Mac sales were nearly flat, rising 1% by revenue and 5% by units. Meanwhile, iPad revenue slumped 13%, with unit sales falling 16%.

Still, the Apple earnings report hit a lot more high notes than anyone expected, particularly with the stock buyback and dividend increase.

But while the stellar earnings report will push Apple stock higher in the short term, it will take more than that to sustain a push back to $600 and beyond.

What Apple (Nasdaq: AAPL) Stock Really Needs

While the pop in iPhone sales was great, it pales next to the days of the 50% or even 100% growth that drove Apple stock from 2007 to 2012.

The reality is that the mobile revolution that Apple helped pioneer is reaching maturity - that was clear in the declining iPad sales.

Most of the people in the world who want a smartphone or tablet already have one by now; the market is almost all about replacements and repeat sales now. And while Apple is holding its own, mature markets don't generate the kind of numbers that can double a stock in a year.

Without that dramatic growth in sales of its mobile hardware, Apple stock has settled into a range between $500 and $575.

The strong earnings report has AAPL back at the top of the range, but is unlikely to push it back anywhere near its all-time highs.

Sure, new iPhones and iPads in the fall will help boost sales seasonally, and maybe give AAPL another short-term pop. But Apple stock can't break out of this range until the company comes out with some completely new product or service.

The rumor mills are full of possibilities here. Apple is alleged to be working on everything from a big-screen TV (very unlikely) to a smartwatch (very likely) to a mobile payment service (also very likely).

Some critics have already started calling for Apple Chief Executive Officer Tim Cook's head for his failure to deliver either new products or substantial growth in any of the existing ones. He doesn't need to fear for his job, but the change in Wall Street's mood is telling - and worrisome.

Apple is known not to debut products until it feels they are truly ready, but unless it actually brings out some major new thing in 2014, the company risks losing its status as a leading Silicon Valley innovator - with other tech titans like Google Inc. (Nasdaq: GOOG) and even Facebook Inc. (Nasdaq: FB) only too happy to fill the void.

Were you impressed by the Apple earnings beat? Where do you see AAPL stock headed in 2014 and 2015? Let us know on Twitter @moneymorning or Facebook.

Tech investing in the current markets can be tricky, so you need to find stocks with powerful potential for growth. And there's no better place to start than a company that's tapping into three of tech's hottest growth trends - data centers, the mobile wave, and cloud computing. It's clearly a winning combo...

Saturday, April 26, 2014

JP Morgan Offering a 17.6% pretax yield

Company History and Business

JPMorgan Chase (JPM) is a global finacial service firm and banking institution operating in 50 countries. It is engaged in investment banking, financial sevices for consumers and small businesses, commercial banking, financial trancactions processing, asset management and private equity. It is a well-run moneymaking machine that =brought in $24 billion in revenues with $2.5 trillion in assets in the last quarter. With a outstanding CEO in Jamie Dimon who has lead the company through the financial crisis, the London Whale Losses, government investigations and a first first quarter 2014 loss, while still ensuring that the earning power of the firm isn't harmed or impaired by these problems.

Jamie Dimon has been the CEO of JPM since 2005 and Chairman of the Board since Dec. 31, 2006. Under his leadership, JPM has become the leading bank in domestic assets under management and market valuation, and the top credit card provider in the U.S. Dimon led JPM through the financial crisis and acquired Bear Stearns and Washington Mutual for pennies on the dollar, increasing JPM in size and scope. But the acquistion of Bear Stearns and Washington Mutual came with mortage-backed securities and potional government lawsuits by the Justice Department. Forseeing that JPM has injected $28 billion into its legal reserves, since the end of 2009. Starting with the London Whale losses, the bank has had the Justice Department investigate the company, resulting in penalties up to $20 billion, most of this happened within the past year.

Finances

Balance Sheet

2013

31/12

2012

31/12

2011

31/12

2010

31/12

Total Current Assets - - - -
Total Assets 2415689 2359141 2265792 2117605
Cash & Due from Banks 39771 53723 59602 27567
Other Earning Assets, Total 1404299 1358307 1271811 1174042
Net Loans 722154 711860 696111 660661
Property/Plant/Equipment, Total - Net 14891 14519 14041 13355
Property/Plant/Equipment, Total - Gross - - - -
Accumulated Depreciation, Total - - - -
Goodwill, Net 48081 48175 48188 48854
Intangibles, Net 11232 9849 10430 17688
Long Term Investments - - - -
Other Long Term Assets, Total - - - -
Other Assets, Total 175261 162708 165609 175438
Total Current Liabilities - - - -
Total Liabilities 2204511 2155072 2082219 1941499
Accounts Payable 194491 195240 202895 170330
Payable/Accrued - - - -
Accrued Expenses - - - -
Total Deposits 1287765 1193593 1127806 930369
Other Bearing Liabilities, Total - - - -
Total Short Term Borrowings 267005 322106 287071 346332
Current Port. of LT Debt/Capital Leases - - - -
Other Current liabilities, Total - - - -
Total Long Term Debt 317506 312215 322752 348302
Long Term Debt 317506 312215 322752 348302
Capital Lease Obligations - - - -
Total Debt 584511 634321 609823 694634
Deferred Income Tax - - - -
Minority Interest - - - -
Other Liabilities, Total 137744 131918 141695 146166
Total Equity 211178 204069 183573 176106
Redeemable Preferred Stock, Total - - - -
Preferred Stock - Non Redeemable, Net 11158 9058 7800 7800
Common Stock, Total 4105 4105 4105 4105
Additional Paid-In Capital 93828 94604 95602 97415
Retained Earnings (Accumulated Deficit) 115756 104223 88315 73998
Treasury Stock - Common -14868 -12023 -13193 -8213
ESOP Debt Guarantee - - - -
Unrealized Gain (Loss) 2798 - - -
Other Equity, Total -1599 4102 944 1001
Total Liabilities & Shareholders' Equity 2415689 2359141 2265792 2117605
Total Common Shares Outstanding 3756.11 3803.95 3772.7 3910.3
Total Preferred Shares Outstanding 1.12 0.91 0.78 0.78

Top Promising Stocks To Own Right Now

Income Statments

2013

31/12

2012

31/12

2011

31/12

2010

31/12

Net Interest Income 43319 44910 47689 51001
Interest Income, Bank 52996 56063 61293 63782
Total Interest Expense 9677 11153 13604 12781
Loan Loss Provision 225 3385 7574 16639
Net Interest Income After Loan Loss Provision 43094 41525 40115 34362
Non-Interest Income, Bank 53287 52121 49545 51693
Non-Interest Expense, Bank -70467 -64729 -62911 -61196
Net Income Before Taxes 25914 28917 26749 24859
Provision for Income Taxes 7991 7633 7773 7489
Net Income After Taxes 17923 21284 18976 17370
Minority Interest - - - -
Equity In Affiliates - - - -
U.S GAAP Adjustment - - - -
Net Income Before Extraordinary Items 17923 21284 18976 17370
Total Extraordinary Items - - - -
Net Income 17923 21284 18976 17370
Total Adjustments to Net Income -1330 -1407 -1408 -1606
Income Available to Common Excluding Extraordinary Items 16593 19877 17568 15764
Dilution Adjustment - - - -
Diluted Net Income 16593 19877 17568 15764
Diluted Weighted Average Shares 3814.9 3822.2 3920.3 3976.9
Diluted EPS Excluding Extraordinary Items 4.35 5.2 4.48 3.96
DPS - Common Stock Primary Issue 1.36 1.2 1 0.2
Diluted Normalized EPS 6.27 5.95 5.37 5.26

For fiscal year 2013, the firm interest income decreased 5% to $53 billion and net interest income after loans after loan loss provision increased 4% to $43.09 billion. It earned $17 billion and had revenues of $96.billon for 2013. The company had legal expenses after taxes of $8.6 billion you the year. Total deposite of $453 billion up 10% from the prior year.

Financial Assets and Liquidity

Ratio's 2013 2011
Debt to Equity 1.68 1.62
Total Equity to Total Assets 0.09 0.09
LT Debt to Total Assets 0.12 0.12
Tier 1 Capital 11.9 12.6
Tier 1 Common 10.7 11.0
Total Capital 14.4 15.3

JPM Pretax Earnings

  Net Common Income to Shareholders Income Tax Pretax Income
1Q2013 6,121 2,553 8,684
2Q2013 6,101 2,802 8,903
3Q2013 5,346 2,278 7,624
4Q2013 5,322 1,258 6,580

JPM 12 month pretax earnings after adding back taxes paid is $31.8 billion. It trades at around $57 with 3.8 billion shares outstanding, giving JPM a market cap of $213 billion that a 14.6% pretax yield. Buying JPM stock at today's price will give a pretax return of 14.6%compaired to the 2.5% on treasury is pretty good.

What JP Morgan Considers Normal Range For Earnings

Under normalize environment JP Morgan net income of $24 billion with growth initiative that will allow the firm to earn more than $24 billion over time. With the growth initiative in place target for earnings of $27 billon. Using the $27.5 billion "normalize" figure with growth initiative and $1.3 billion in benefit from a 100 basis point increase in interest rates that would come to $39.3 billion pretax. Assuming a 30% tax rate and deducting $1.5 billion in preferred dividends thats leaves $37.8 billion. This implices a 17.8% pretax yield based on shares out standing and the current stock price.

Risk to JPM

There are risks to JPM mainly from the Department of Justice and its investigations of the bank. With $28 billion in its legal reserve it can weather the penalities from the Department of Justice. JPM has penalties totaling $20 billion from the Department of Justice. Department of Justice penalties broken down:

$2 billion civil penalties to settles DOJ claims under the Finacial Institutions Reform, Recovery, and Enforcement. $1.4 billion to settle federal and state securities claim by the National Credit Union Administration $515.4 million to federal and state securities claims by the Federal Deposit Insurance Corporation $4 billion to federal and stater securities claims by the Federal Housing Agency $298.8 million to claims by the state of California $19.7 million to claims by the state of Delaware $100 million to claims by the state of Illionois $34.4 million to claims by the state of Massachusetts $613.8 million to claims by the stae of New York

JPM said about $7 billion of its penalties were tax-deductable, because of these penalties it earnings fell flat for the four quarter. JPM still has legal risk, but there is little risk to its business model, and earning power.

JPM Valuation

The firm is selling for 13x its earnings, 2.5x free cash flow, and 1.00x book value which shows that the company isn't cheap, but it is selling below its intrinsic value based on its pretax earnings, free cash flow and book value. JPM offers a 14.6% pretax return plus it's worth $86/share base on 10x its pretax earnings. By using $37.8 billion pretax earning or $9.94 per share at 10x will give you a $99.40 per share value and a 17% pretax return. JPM will continue to grow its earnings and make more money on its loans as interest rate moves up. Compared to Wells Fargo which offers a 12.8% pretax return, you'll getting one the best managed banks in the world with a higher return. JPM didn't just survived the 2008 crisis it thrived on it, making the bank one of the most stable and sound banks in the world. If JP Morgan traded at the same price to free cash flow as Wells Fargo then the company would sell for $130.00 per share or at the same price to book value $95.04 per share. Based on all of this it is very clear that JP Morgan intrinsic value is $99.40 per share and offers a 17% pretax yield which make it a great Long-Term Play for potential investors.

http://files.shareholder.com/downloads/ONE/3120446062x0x742266/2bd13119-52d2-4d78-9d85-a433141c21ae/01-2013AR_FULL_09.pdf

http://files.shareholder.com/downloads/ONE/3120447064x0x652147/a734543b-03fa-468d-89b0-fa5a9b1d9e5f/JPMC_2012_AR.pdf

http://money.cnn.com/2014/04/11/investing/premarkets/

About the author:Cody Eustice

Visit Cody Eustice's Website

Currently 5.00/512345

Rating: 5.0/5 (1 vote)

Voters:
Email FeedsSubscribe via Email RSS FeedsSubscribe RSS Comments Please leave your comment:
More GuruFocus Links
Latest Guru Picks Value Strategies
Warren Buffett Portfolio Ben Graham Net-Net
Real Time Picks Buffett-Munger Screener
Aggregated Portfolio Undervalued Predictable
ETFs, Options Low P/S Companies
Insider Trends 10-Year Financials
52-Week Lows Interactive Charts
Model Portfolios DCF Calculator
RSS Feed Monthly Newsletters
The All-In-One Screener Portfolio Tracking Tool
iPhone App MORE GURUFOCUS LINKS
Latest Guru Picks Value Strategies
Warren Buffett Portfolio Ben Graham Net-Net
Real Time Picks Buffett-Munger Screener
Aggregated Portfolio Undervalued Predictable
ETFs, Options Low P/S Companies
Insider Trends 10-Year Financials
52-Week Lows Interactive Charts
Model Portfolios DCF Calculator
RSS Feed Monthly Newsletters
The All-In-One Screener Portfolio Tracking Tool
JPM STOCK PRICE CHART 55.7 (1y: +14%) $(function(){var seriesOptions=[],yAxisOptions=[],name='JPM',display='';Highcharts.setOptions({global:{useUTC:true}});var d=new Date();$current_day=d.getDay();if($current_day==5||$current_day==0||$current_day==6){day=4;}else{day=7;} seriesOptions[0]={id:name,animation:false,color:'#4572A7',lineWidth:1,name:name.toUpperCase()+' stock price',threshold:null,data:[[1367211600000,48.92],[1367298000000,49.01],[1367384400000,48.01],[1367470800000,48.08],[1367557200000,47.57],[1367816400000,48.18],[1367902800000,49.14],[1367989200000,49.76],[1368075600000,49.04],[1368162000000,48.96],[1368421200000,49.67],[1368507600000,50.23],[1368594000000,51.09],[1368680400000,50.97],[1368766800000,52.3],[1369026000000,52.29],[1369112400000,53.02],[1369198800000,53.63],[1369285200000,53.35],[1369371600000,53.66],[1369717200000,54.6],[1369803600000,54.67],[1369890000000,55.62],[1369976400000,54.59],[1370235600000,54.49],[1370322000000,54.04],[1370408400000,53.03],[1370494800000,53.5],[1370581200000,54.27],[1370840400000,54.36],[1370926800000,53.49],[1371013200000,53.18],[1371099600000,54.17],[1371186000000,53.13],[1371445200000,53.85],[1371531600000,54.11],[1371618000000,53.55],[1371704400000,52.48],[1371790800000,51.96],[1372050000000,50.92],[1372136400000,52.08],[1372222800000,52.5],[1372309200000,53.15],[1372395600000,52.79],[1372654800000,52.49],[1372741200000,52.8],[1372827600000,52.77],[1373000400000,53.99],[1373259600000,54.7],[1373346000000,54.89],[1373432400000,54.83],[1373518800000,55.14],[1373605200000,54.97],[1373864400000,54.89],[1373950800000,55.01],[1374037200000,55.27],[1374123600000,56.37],[1374210000000,56.16],[1374469200000,56.56],[1374555600000,56.67],[1374642000000,56.63],[1374728400000,56.5],[1374814800000,56.05],[1375074000000,55.69],[1375160400000,55.33],[1375246800000,55.73],[1375333200000,56.54],[1375419600000,56.49],[1375678800000,56.1],[1375765200000,55.49],[1375851600000,55.3],[1375938000000,54.83],[1376024400000,54.52],[1376283600000,54.09],[1376370000000,54.29],[1376456400000,54.15],[1376542800000,53.29],[1376629200000,53.29],[1376888400000,51.83],[1376974800000,52.12],[1377061200000,51.63],[1377147600000,52.21],[1377234000000,52.32],[1377493200000,51.8],[1377579600000,50.6],[1377666000000,50.58],[1377752400000,50.7],[137783! 8800000,50.53],[1378184400000,51.13],[1378270800000,51.87],[1378357200000,52.11],[1378443600000,52.56],[1378702800000,52.86],[1378789200000,53.67],[1378875600000,53.26],[1378962000000,52.24],[1379048400000,52.59],[1379307600000,53.14],[1379394000000,53.09],[1379480400000,53.41],[1379566800000,52.75],[1379653200000,52.8],[1379912400000,51.46],[1379998800000,50.32],[1380085200000,51.7],[1380171600000,51.89],[1380258000000,52.24],[1380517200000,51.69],[1380603600000,51.96],[1380690000000,52.09],[1380776400000,51.94],[1380862800000,52.67],[1381122000000,51.83],[1381208400000,50.87],[1381294800000,50.75],[1381381200000,52.52],[1381467600000,52.51],[1381726800000,52.71],[1381813200000,52.31],[1381899600000,54],[1381986000000,54.21],[1382072400000,54.3],[1382331600000,54.27],[1382418000000,53.62],[1382504400000,52.75],[1382590800000,52.48],[1382677200000,52.77],[1382936400000,52.68],[1383022800000,52.73],[1383109200000,52.6],[1383195600000,51.54],[1383282000000,52.51],[1383544800000,52.04],[1383631200000,51.95],[1383717600000,52.1],[1383804000000,51.65],[1383890400000,53.96],[1384149600000,54.1],[1384236000000,53.97],[1384322400000,54.14],[1384408800000,54.4],[1384495200000,54.87],[1384754400000,55.74],[1384840800000,56.15],[1384927200000,56.1],[1385013600000,57.22],[1385100000000,57.46],[1385359200000,57.65],[1385445600000,57.17],[1385532000000,57.48],[1385704800000,57.22],[1385964000000,56.98],[1386050400000,56.86],[1386136800000,57.19],[1386223200000,55.82],[1386309600000,56.06],[1386568800000,56.51],[1386655200000,56.7],[1386741600000,56.07],[1386828000000,56.31],[1386914400000,56.17],[1387173600000,56.42],[1387260000000,55.72],[1387346400000,57.24],[1387432800000,57.23],[1387519200000,57.7],[1387778400000,58.24],[1387864800000,58.25],[1388037600000,58.2],[1388124000000,58.14],[1388383200000,57.95],[1388469600000,58.48],[1388642400000,58.21],[1388728800000,58.66],[1388988000000,59],[1389074400000,58.32],[1389160800000,58.87],[1389247200000,58.76],[1389333600000,58.49],[1389592800000,57.7],[1389679200000,57! .74],[138! 9765600000,59.49],[1389852000000,58.99],[1389938400000,58.11],[1390284000000,58.17],[1390370400000,57.59],[1390456800000,56.47],[1390543200000,55.09],[1390802400000,55.09],[1390888800000,55.74],[1390975200000,55.53],[1391061600000,56],[1391148000000,55.36],[1391407200000,54.31],[1391493600000,54.95],[1391580000000,55.21],[1391666400000,56.48],[1391752800000,56.62],[1392012000000,56.74],[1392098400000,57.43],[1392184800000,57.52],[1392271200000,58.03],[1392357600000,58.15],[1392703200000,58.49],[1392789600000,57.26],[1392876000000,57.58],[1392962400000,57.61],[1393221600000,58.03],[1393308000000,57.03],[1393394400000,56.75],[1393826400000,56.21],[1393912800000,57.26],[1393999200000,58.16],[1394085600000,58.9],[1394172000000,59.4],[1394427600000,59.2],[1394514000000,58.19],[1394600400000,57.92],[1394686800000,57.42],[1394773200000,56.8],[1395032400000,57.58],[1395118800000,58.06],[1395205200000,58.3],[1395291600000,60.11],[1395378000000,60.17],[1395637200000,61.07],[1395723600000,60.93],[1395810000000,59.9],[1395896400000,59.92],[1395982800000,60.04],[1396328400000,60.67],[1396414800000,60.48],[1396501200000,60.66],[1396587600000,59.81],[1396846800000,59],[1396933200000,58.85],[1397019600000,59.27],[1397106000000,57.4],[1397192400000,55.3],[1397451600000,54.96],[1397538000000,54.8],[1397624400000,55.26],[1397710800000,55.22],[1398056400000,55.03],[1398142800000,55.81],[1398229200000,56.05],[1398315600000,56.19],[1398402000000,55.7],[1398512137000,55.7],[1398512137000,55.7],[1398438094000,55.7]]};var reporting=$('#reporting');Highcharts.setOptions({lang:{rangeSelectorZoom:""}});var chart=new Highcharts.StockChart({chart:{renderTo:'container_chart',marginRight:20,borderRadius:0,events:{load:function(){var chart=this,axis=chart.xAxis[0],buttons=chart.rangeSelector.buttons;function reset_all_buttons(){$.each(chart.rangeSelector.buttons,function(index,value){value.setState(0);});series=chart.get('JPM');series.remove();} buttons[0].on('click',function(e){chart.showLoading();reset_all_buttons();chart.rangeSelector.buttons[0].setState(2);var extremes=axis.getExtremes();$.getJSON('/modules/chart/price_chart_json.php?symbol=JPM&ser=1d',function(data){if(data!=null){var extremes=axis.getExtremes();axis.setExtremes(data[1][0][0],data[1][data[1].length-1][0]);chart.addSeries({name:'JPM',id:'JPM',color:'#4572A7',data:data[1]});if(data[0][1]>=0){display=data[0][0]+" (1D: +"+data[0][1]+"%)";reporting.html(display);}else{display=data[0][0]+" (1D: "+data[0][1]+"%)";reporting.html(display);} chart.hideLoading();}});});buttons[1].on('click',function(e){chart.showLoading();reset_all_buttons();chart.rangeSelector.buttons[1].setState(2);var extremes=axis.getExtremes();$.getJSON('/modules/chart/price_chart_json.php?symbol=JPM&ser=5d',function(data){if(data!=null){var extremes=axis.getExtremes();axis.setExtremes(data[1][0][0],data[1][data[1].length-1][0]);chart.addSeries({name:'JPM',id:'JPM',color:'#4572

Friday, April 25, 2014

3 Hot Stocks on Traders' Radars

BALTIMORE (Stockpickr) -- Put down the 10-K filings and the stock screeners. It's time to take a break from the traditional methods of generating investment ideas. Instead, let the crowd do it for you.

>>5 Mega-Cap Stocks to Trade for Gains

From hedge funds to individual investors, scores of market participants are turning to social media to figure out which stocks are worth watching. It's a concept that's known as "crowdsourcing," and it uses the masses to identify emerging trends in the market.

Crowdsourcing has long been a popular tool for the advertising industry, but it also makes a lot of sense as an investment tool. After all, the market is completely driven by the supply and demand, so it can be valuable to see what names are trending among the crowd.

While some fund managers are already trying to leverage social media resources like Twitter to find algorithmic trading opportunities, for most investors, crowdsourcing works best as a starting point for investors who want a starting point in their analysis. Today, we'll leverage the power of the crowd to take a look at some of the most active stocks on the market today.

>>5 Stocks Under $10 Set to Soar

These "most active" names are the most heavily-traded names on the market -- and often, uber-active names have some sort of a technical or fundamental catalyst driving investors' attention on shares. And when there's a big catalyst, there's often a trading opportunity.

Without further ado, here's a look at today's stocks.

General Motors


Nearest Resistance: $35.50

Nearest Support: $32

Catalyst: Q1 Earnings

Despite some big black clouds over its first-quarter earnings call, General Motors (GM) beat analysts' expectations by 2 cents, taking home 6 cents per share in profit. Recalls hammered earnings, with a $1.3 billion one-time charge for recall repairs on the books. But while things were "less bad" than expected, investors are pushing shares lower on big volume this afternoon.

Looking longer-term, GM's chart could actually look a lot worse. This stock is looking "bottomy" after spending all of 2014 selling off to the tune of 14%. A breakout above $35.50 is the signal that it's time to be a buyer in GM.

ServiceNow


Nearest Resistance: $55

Nearest Support: $49

Catalyst: Q1 Earnings

$7 billion cloud-based IT service firm ServiceNow (NOW) is down 6% on big volume this afternoon, following a wider-than-expected loss for the first quarter. NOW lost 30 cents per share in the first three months of 2014, while investors were only expecting a consensus loss of 8 cents. The fundamental miss isn't a game-changer for this stock, but the technical miss paints a different picture.

NOW looks "toppy" in the longer-term. Shares have been forming a head and shoulders top since the start of October, a bearish setup that triggers on a move through support at $49. The setup in NOW is a long-term pattern, and that means that it comes with equally long-term trading implications on a breakdown below that $49 level. Shares flirted with a breakdown this morning before recovering later in the day. Keep a close eye on NOW's ability to catch a bid this week.

Verizon


Nearest Resistance: $48 

Nearest Support: $44.50

Catalyst: Q1 Earnings, Technical Setup

Verizon Communications (VZ) is seeing some earnings-induced selling of its own this afternoon. Verizon posted its first-quarter numbers this morning, earning 84 cents for the last three months. That number fell 3 cents short of the 87 cent profit that analysts were expecting, but the real story is in subscriber count -- VZ lost wireless customers for the first time in its history last quarter, a byproduct of a hugely competitive market that's quickly becoming commoditized.

From a technical standpoint, the 2.7% drop on high volume today shouldn't come as a big surprise. After all, VZ has been bouncing lower in a well-defined trend channel since last November. With shares touching the top of the range back on Monday, a move lower was the high-probability outcome unless VZ really impressed investors. Look for shares to settle closer to $44.50 from here.

To see these stocks in action, check out the at Most-Active Stocks portfolio on Stockpickr.


-- Written by Jonas Elmerraji in Baltimore.


RELATED LINKS:


>>QE5 Is Coming -- Here's What It Means to Your Portfolio


>>5 Stocks With Big Insider Buying


>>3 Big-Volume Stocks to Trade for Breakouts

Follow Stockpickr on Twitter and become a fan on Facebook.

At the time of publication, author was long AAPL.

Jonas Elmerraji, CMT, is a senior market analyst at Agora Financial in Baltimore and a contributor to

TheStreet. Before that, he managed a portfolio of stocks for an investment advisory returned 15% in 2008. He has been featured in Forbes , Investor's Business Daily, and on CNBC.com. Jonas holds a degree in financial economics from UMBC and the Chartered Market Technician designation.

Follow Jonas on Twitter @JonasElmerraji


Thursday, April 24, 2014

Forest Laboratories Is an Option for Wealthy Investors Who Could Afford to Pay a High Premium

Forest Laboratories Inc. (FRX) is one of the largest U.S.-based pharmaceutical companies in the area of developing, producing and selling central nervous system (CNS)-related prescription drugs. The company also focuses on the development and introduction of new products, including products developed in collaboration with licensing partners.

The company's principal products include Namenda (memantineHCl) for Alzheimer´s disease, Savella (milnacipranHCl) for fibromyalgia, Bystolic for hypertension and Benicar (olmesartanmedoxomil) for high blood pressure.

In this article, let's take a look at this lab and try to explain to investors the reasons this is an apparently appealing investment opportunity.

Cost-Cutting Initiative

Forest Laboratories expects to make savings of $500 million by fiscal 2016 in R&D. The company said about $270 million of the savings will come from streamlining and realigning its research and development arm, while $150 million will result from cutting marketing expenses, with the remaining from reducing general, administrative and other expenses.

The cost-cutting effort could lead also to the elimination of 10% to 20% of its workforce on Long Island. These staffing cuts are part of Project Rejuvenate, a plan announced in December to reduce costs and streamline operations across the company's various locations.

A Deal to Buy Schizophrenia Drug Saphris

The lab agreed to acquire exclusive U.S. rights to Merck & Co. (MRK)'s sublingual tablets for adults with schizophrenia and bipolar disorder, paying $240 million for the drug while committing to a slate of unspecified sales milestones.

Forest´s Acquisition

In January 2014, Forest acquired Toronto-based Aptalis, a privately held U.S.-based specialty Gastrointestinal (GI) and Cystic Fibrosis Company, for $2.9 billion in cash from its shareholders, including TPG, the global private investment firm. The deal looks attractive especially keeping in mind the fact that Namenda will be facing generic competition from 2015. The acquisition will also give Forest the opportunity to build its presence in Europe and strengthen its GI and CF portfolios.

The Merger

In February 2014, Forest was itself acquired by Actavis, a speciality pharmaceuticals company based at Parsippany, N.J., in a deal worth about $25 billion. The deal will create a powerhouse biopharma company with an extensive generics business, branded drugs and ambitious R&D operations. "The combination of Forest with Actavis creates a specialty company with annual sales of approximately $15 billion, a diversified portfolio and a geographically balanced business," said CEO of Forest, Brent Saunders. In recent days, both companies received a request for additional information from the Federal Trade Commission in connection with Actavis' pending acquisition of Forest.

Top 5 Chemical Companies To Own In Right Now

Relative Valuation, Earnings and ROE

In terms of valuation, the stock sells at a trailing P/E of 116x, trading at a premium compared to the industry mean. Due to its revenue growth, Earnings per share (EPS) have increased in a good way in the most recent quarter compared to the same quarter a year ago. In the next graph we include the stock price because EPS often lead the stock price movement. As we can appreciate in the chart, the price performance was really good in the past year.

1398204039379.png

Finally, I always like to see one of the most important financial ratios applying to stockholders, the best measure of performance for a firm's management: the return on equity. The ratio has increased from the same quarter one year prior. This is a clear sign of strength within the company.

Let´s compare the current ratio with the peer group in the next table:

Ticker

Company Name

P/E

ROE (%)

FRX

FOREST LABORATORIES INC

116

2,69

AGN

ALLERGAN INC

32

16

ENDP

ENDO INTERNATIONAL PLC

47

-86

VRX

VALEANT PHARMACEUTICALS INTERNATIONAL

N/A

-20

CBST

CUBIST PHARMACEUTICALS INC

69

-1,6

ATLN.VX

ACTELION LTD-REG

20

29,2

Forest Laboratories has a current ratio of 2.69% which is higher than the ones registered by Endo International Plc (ENDP), Valeant Pharmaceuticals International (VRX) and Cubist Pharmaceuticals Inc. (CBST). For investors looking for a higher ROE, Allergan Inc. (AGN) and Actelion Ltd. (ATLN.VX) are good options.

Final Comment

As outlined in this article, we think Saphris should be a good fit in Forest´s central nervous system (CNS) franchise. Additionally, Forest´s acquisition of Aptalis looks attractive, especially taking into account that Namenda will be facing generic competition from 2015. The deal will give Forest the opportunity to build its presence in Europe and strengthen its position in the gastrointestinal (GI) market in the U.S. and Canada and the cystic fibrosis (CF) market in Europe.

I would recommend investors to consider adding the stock for their long-term portfolios. Hedge fund gurus have also been active in the company in the fourth quarter of 2013. Gurus like Ray Dalio (Trades, Portfolio), Jean-Marie Eveillard (Trades, Portfolio), Paul Tudor Jones (Trades, Portfolio), Murray Stahl (Trades, Portfolio) and Dodge & Cox have taken long positions on it in that time frame.

Disclosure: Victor Selva holds no position in any stocks mentioned.

Also check out: Dodge & Cox Undervalued Stocks Dodge & Cox Top Growth Companies Dodge & Cox High Yield stocks, and Stocks that Dodge & Cox keeps buying Jean-Marie Eveillard Undervalued Stocks Jean-Marie Eveillard Top Growth Companies Jean-Marie Eveillard High Yield stocks, and Stocks that Jean-Marie Eveillard keeps buying
Currently 5.00/512345

Rating: 5.0/5 (2 votes)

Voters:
Email FeedsSubscribe via Email RSS FeedsSubscribe RSS Comments Please leave your comment:
More GuruFocus Links
Latest Guru Picks Value Strategies
Warren Buffett Portfolio Ben Graham Net-Net
Real Time Picks Buffett-Munger Screener
Aggregated Portfolio Undervalued Predictable
ETFs, Options Low P/S Companies
Insider Trends 10-Year Financials
52-Week Lows Interactive Charts
Model Portfolios DCF Calculator
RSS Feed Monthly Newsletters
The All-In-One Screener Portfolio Tracking Tool
iPhone App MORE GURUFOCUS LINKS
Latest Guru Picks Value Strategies
Warren Buffett Portfolio Ben Graham Net-Net
Real Time Picks Buffett-Munger Screener
Aggregated Portfolio Undervalued Predictable
ETFs, Options Low P/S Companies
Insider Trends 10-Year Financials
52-Week Lows Interactive Charts
Model Portfolios DCF Calculator
RSS Feed Monthly Newsletters
The All-In-One Screener Portfolio Tracking Tool
FRX STOCK PRICE CHART 91.65 (1y: +148%) $(function(){var seriesOptions=[],yAxisOptions=[],name='FRX',display='';Highcharts.setOptions({global:{useUTC:true}});var d=new Date();$current_day=d.getDay();if($current_day==5||$current_day==0||$current_day==6){day=4;}else{day=7;} seriesOptions[0]={id:name,animation:false,color:'#4572A7',lineWidth:1,name:name.toUpperCase()+' stock price',threshold:null,data:[[1366779600000,36.99],[1366866000000,36.95],[1366952400000,37.03],[1367211600000,37.21],[1367298000000,37.41],[1367384400000,37.03],[1367470800000,37.1],[1367557200000,37.57],[1367816400000,37.2],[1367902800000,36.97],[1367989200000,37.7],[1368075600000,37.96],[1368162000000,38.26],[1368421200000,38.16],[1368507600000,38.69],[1368594000000,39.02],[1368680400000,38.7],[1368766800000,38.53],[1369026000000,37.98],[1369112400000,37.92],[1369198800000,37.51],[1369285200000,39.53],[1369371600000,39.23],[1369717200000,40.41],[1369803600000,39.91],[1369890000000,40.21],[1369976400000,39.75],[1370235600000,40.13],[1370322000000,40.09],[1370408400000,39.95],[1370494800000,40.33],[1370581200000,40.45],[1370840400000,41.03],[1370926800000,39.83],[1371013200000,39.72],[1371099600000,40.65],[1371186000000,41.08],[1371445200000,41.28],[1371531600000,41.57],[1371618000000,41.84],[1371704400000,40.19],[1371790800000,40.83],[1372050000000,40.46],[1372136400000,40.65],[1372222800000,40.69],[1372309200000,40.95],[1372395600000,41],[1372654800000,41.72],[1372741200000,41.71],[1372827600000,41.83],[1373000400000,42.39],[1373259600000,42.49],[1373346000000,42.6],[1373432400000,43.35],[1373518800000,43.79],[1373605200000,43.92],[1373864400000,43.98],[1373950800000,43.37],[1374037200000,43.35],[1374123600000,43.49],[1374210000000,43.76],[1374469200000,43.75],[1374555600000,44.25],[1374642000000,44.19],[1374728400000,43.99],[1374814800000,44.41],[1375074000000,43.58],[1375160400000,43.77],[1375246800000,43.56],[1375333200000,44.66],[1375419600000,44.71],[1375678800000,44.54],[1375765200000,44.34],[1375851600000,44.17],[1375938000000,44.36],[1376024400000,43.81],[1376283600000,43.45],[1376370000000,43.34],[1376456400000,43.28],[1376542800000,42.61],[1376629200000,42.43],[1376888400000,42.25],[1376974800000,42.46],[1377061200000,42.77],[1377147600000,42.99],[1377234000000,42.8],[1377493200000,42.96],[137! 7579600000,42.26],[1377666000000,42.51],[1377752400000,42.75],[1377838800000,42.53],[1378184400000,42.82],[1378270800000,43.4],[1378357200000,43.34],[1378443600000,43.21],[1378702800000,43.42],[1378789200000,43.56],[1378875600000,44.33],[1378962000000,44.26],[1379048400000,44.12],[1379307600000,44.66],[1379394000000,44.6],[1379480400000,44.78],[1379566800000,44.41],[1379653200000,44.27],[1379912400000,43.69],[1379998800000,43.32],[1380085200000,43.12],[1380171600000,43.3],[1380258000000,43.17],[1380517200000,42.79],[1380603600000,43.28],[1380690000000,43.11],[1380776400000,42.9],[1380862800000,43.27],[1381122000000,42.87],[1381208400000,42.65],[1381294800000,42.69],[1381381200000,43.02],[1381467600000,43.3],[1381726800000,43.4],[1381813200000,43.03],[1381899600000,44.15],[1381986000000,44.72],[1382072400000,44.44],[1382331600000,44.31],[1382418000000,46.54],[1382504400000,46.57],[1382590800000,47.25],[1382677200000,47.34],[1382936400000,46.87],[1383022800000,47.23],[1383109200000,46.81],[1383195600000,47.03],[1383282000000,47.15],[1383544800000,46.99],[1383631200000,46.91],[1383717600000,47.41],[1383804000000,47.31],[1383890400000,48],[1384149600000,48.96],[1384236000000,49.28],[1384322400000,50.44],[1384408800000,51.19],[1384495200000,51.66],[1384754400000,51.44],[1384840800000,51.32],[1384927200000,51.42],[1385013600000,51.18],[1385100000000,51.58],[1385359200000,51.19],[1385445600000,51.6],[1385532000000,51.03],[1385704800000,51.31],[1385964000000,56.32],[1386050400000,56.44],[1386136800000,56.27],[1386223200000,55.75],[1386309600000,56.91],[1386568800000,56.44],[1386655200000,55.32],[1386741600000,55.25],[1386828000000,54.99],[1386914400000,55.46],[1387173600000,55.33],[1387260000000,55.63],[1387346400000,56.98],[1387432800000,56.93],[1387519200000,57.32],[1387778400000,58.17],[1387864800000,58.6],[1388037600000,59.15],[1388124000000,59.6],[1388383200000,60.19],[1388469600000,60.03],[1388642400000,59.63],[1388728800000,59.62],[1388988000000,58.47],[1389074400000,58.76],[1389160800000,69.3],[13892472! 00000,69.! 17],[1389333600000,69],[1389592800000,67.73],[1389679200000,69.97],[1389765600000,69.1],[1389852000000,68.28],[1389938400000,68.74],[1390284000000,68],[1390370400000,67.02],[1390456800000,67.49],[1390543200000,64.95],[1390802400000,65.14],[1390888800000,66.1],[1390975200000,64.82],[1391061600000,66.3],[1391148000000,66.3],[1391407200000,64.44],[1391493600000,66.16],[139158

Wednesday, April 23, 2014

Why Taylor Capital Shares Skyrocketed

Although we don't believe in timing the market or panicking over market movements, we do like to keep an eye on big changes -- just in case they're material to our investing thesis.

What: Shares of Taylor Capital (NASDAQ: TAYC  ) , the holding company of Cole Taylor Bank, a commercial and consumer lending and financial services company located in the Chicago area, skyrocketed as much as 22% after agreeing to be purchased by MB Financial (NASDAQ: MBFI  ) .

So what: Under the terms of the deal and as of Friday's closing value, MB Financial is offering $22 per share, close to $680 million, for Taylor Capital. MB Financial plans to finance the deal with a mixture of cash and stock -- $4.08 in cash and 0.64318 shares of MB Financial for each share of Taylor Capital. The acquisition by MB Financial is expected to boost the bank into the top-five market share for Cook County in Illinois and is forecast to be immediately accretive to earnings. MB Financial noted the deal would close sometime in the first half of 2014.

10 Best Japanese Stocks To Own Right Now

Now what: The deal is pretty straightforward in many respects and looks like a win-win for both parties involved. There is a bit of uncertainty for Taylor Capital shareholders in that a good chunk of the deal is being financed with MB Financial shares, so any fall there will negatively impact the purchase price. However, I continue to feel that no sector offers a better pathway for consolidation than regional banks -- evidenced by the deal we're seeing today between Taylor Capital and MB Financial. Expect to see more deals like this if U.S. economic growth continues along at this slow but steady pace.

With so much of the financial industry getting bad press these days, it may be a greedy when others are fearful moment. However, many banks are on the mend, and, not surprisingly, some of Warren Buffett's biggest investments are in the space. In the Motley Fool's free report, "The Stocks Only the Smartest Investors Are Buying," you can learn about a small, under-the-radar bank that's too tiny for Buffett's billions. Too bad, because it has better operating metrics than his favorites. Just click here to keep reading.

Tuesday, April 22, 2014

Hedge Funds Shake Financial System More Than Banks During Crises: Study

Hedge funds may play an even bigger role than banks in transmitting financial shocks to the rest of the market, and thus may intensify systemic risk more than previously thought, according to new research.

An economic letter issued last week by the Federal Reserve Bank of San Francisco reported a new risk measurement that suggests that financial crises intensify spillover effects among certain types of financial institutions.

It shows that hedge funds may be the most important transmitters of shocks during crises.

Reint Gropp, a visiting scholar at the San Francisco Fed from Goethe University in Frankfurt, developed a new way to measure spillover effects, and estimated the effects for investment banks, commercial banks, insurance companies and hedge funds.

How big and how long risk spillovers among financial institutions last depend on whether markets are in normal times or in crisis, Gropp reported. They can be much larger during crisis times.

He found that insurance companies — the case of AIG during the recent financial crisis notwithstanding — are not systemically important in causing distress elsewhere. They tend to be relatively safe in crises, as their returns are negatively correlated to those of other institutions.

In contrast, spillovers from hedge funds during crises become huge, and make the funds more important shock transmitters than either commercial or investment banks.

The reason is that hedge funds are opaque and highly leveraged, Gropp said. If forced to liquidate under duress, they may sustain big losses, possibly leading to further defaults or threatening systemically important entities both directly as counterparties or creditors and indirectly through asset price adjustments.

How big are the spillover effects from hedge funds? Gropp said that during normal market conditions a one percentage-point increase in hedge fund riskiness raises risk of investment banks by an estimated 0.09 percentage point.

During crises, the same shock increases the risk of investment banks by 0.71 percentage point.

By comparison, a one percentage-point increase in risk of commercial banks leads to a 0.01 percentage-point increase in risk of investment banks during normal times, and a 0.05 percentage point increase during crises.

Hedge fund spillover effects are largest after 10 to 15 days, and subside after about three months, according to Gropp.

He said more research is needed to explain the mechanisms that underlie the estimated spillover effects.

Monday, April 21, 2014

Medicare vs. private insurance: Which costs less

medicare pays less 
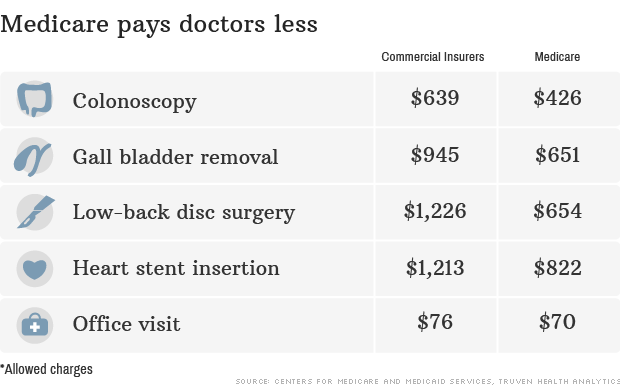
NEW YORK (CNNMoney) Wonder why some doctors grumble when a Medicare patient walks in the door? It's likely because the government program typically pays only 80% of what private insurers do.

Medicare has the bad rap of being a big, bloated government program, but it's not because it's overpaying doctors.

CNNMoney analyzed the "allowed charges" for five common procedures, using data provided the Centers for Medicare and Medicaid Services and Truven Health Analytics, a research firm.

The differences can be stark. Private insurers allow an average of $1,226 for low-back disc surgery, while Medicare will only permit $654, for instance.

And the gap can grow wider depending on where the patient is. In New York, insurers allow $1,352 for a gall bladder removal, compared to $580 for Medicare.

Some services are more comparable. For office visits by established patients, for instance, Medicare will allow 92% of what insurers do.

Overall, Medicare's allowed charges are roughly 80% of the charges allowed by private insurers - about the same as they have been since 1999.

Obamacare in a Texas insurance desert   Obamacare in a Texas insurance desert

Sometimes, however, the government does reimburse health care providers more. In Florida, for instance, a doctor doing a colonoscopy in his office will receive $395 for a Medicare patient, but only $342 for one covered by private insurance.

How does Medicare get away with paying less?

"Medicare doesn't negotiate rates. It sets them," said Stuart Guterman, vice president at The Commonwealth Fund, an independent health policy research group.

And doctors might be okay getting less per procedure because Medicare patients tend to need a lot of care. As a result, the total bill can add up. Nearly 4,000 doctors were paid more than $1 million from Medicare, according to data released this month.

Private insurers, meanwhile, can't cut rates that deeply or they risk a revolt by doctors, who may opt to leave the carrier.

"When you want to market your health plan, you want t! o say all the great doctors are in your network," said Anne Fischer, director of Truven's Center for Healthcare Analytics.

This balancing act became evident when the Obamacare exchanges launched in October. In order to keep premiums low, insurers offered plans with more limited access to doctors and hospitals. Many health care providers complained that insurers' rates for exchange plans were too low, so they opted not to participate.

Why, then, is Medicare considered bloated?

It's more about use than prices, with the government under more pressure to pay for whatever services the doctor prescribes or the patient wants, Guterman said.

Insurers, meanwhile, have more tools to limit potentially unnecessary procedures. These include pre-authorization requirements to determine whether a treatment plan is medically justified.

"Medicare spending goes up because people use it more," he said.

To top of page

Sunday, April 20, 2014

Why Body Central's Earnings May Not Be So Hot

Although business headlines still tout earnings numbers, many investors have moved past net earnings as a measure of a company's economic output. That's because earnings are very often less trustworthy than cash flow, since earnings are more open to manipulation based on dubious judgment calls.

Earnings' unreliability is one of the reasons Foolish investors often flip straight past the income statement to check the cash flow statement. In general, by taking a close look at the cash moving in and out of the business, you can better understand whether the last batch of earnings brought money into the company, or merely disguised a cash gusher with a pretty headline.

Calling all cash flows
When you are trying to buy the market's best stocks, it's worth checking up on your companies' free cash flow once a quarter or so, to see whether it bears any relationship to the net income in the headlines. That's what we do with this series. Today, we're checking in on Body Central (Nasdaq: BODY  ) , whose recent revenue and earnings are plotted below.

Source: S&P Capital IQ. Data is current as of last fully reported fiscal quarter. Dollar values in millions. FCF = free cash flow. FY = fiscal year. TTM = trailing 12 months.

Over the past 12 months, Body Central burned $1.1 million cash while it booked net income of $8.7 million. That means it burned through all its revenue and more. That doesn't sound so great. FCF is less than net income. Ideally, we'd like to see the opposite.

All cash is not equal
Unfortunately, the cash flow statement isn't immune from nonsense, either. That's why it pays to take a close look at the components of cash flow from operations, to make sure that the cash flows are of high quality. What does that mean? To me, it means they need to be real and replicable in the upcoming quarters, rather than being offset by continual cash outflows that don't appear on the income statement (such as major capital expenditures).

For instance, cash flow based on cash net income and adjustments for non-cash income-statement expenses (like depreciation) is generally favorable. An increase in cash flow based on stiffing your suppliers (by increasing accounts payable for the short term) or shortchanging Uncle Sam on taxes will come back to bite investors later. The same goes for decreasing accounts receivable; this is good to see, but it's ordinary in recessionary times, and you can only increase collections so much. Finally, adding stock-based compensation expense back to cash flows is questionable when a company hands out a lot of equity to employees and uses cash in later periods to buy back those shares.

So how does the cash flow at Body Central look? Take a peek at the chart below, which flags questionable cash flow sources with a red bar.

Source: S&P Capital IQ. Data is current as of last fully reported fiscal quarter. Dollar values in millions. TTM = trailing 12 months.

When I say "questionable cash flow sources," I mean items such as changes in taxes payable, tax benefits from stock options, and asset sales, among others. That's not to say that companies booking these as sources of cash flow are weak, or are engaging in any sort of wrongdoing, or that everything that comes up questionable in my graph is automatically bad news. But whenever a company is getting more than, say, 10% of its cash from operations from these dubious sources, investors ought to make sure to refer to the filings and dig in.

With 19.1% of operating cash flow coming from questionable sources, Body Central investors should take a closer look at the underlying numbers. Within the questionable cash flow figure plotted in the TTM period above, stock-based compensation and related tax benefits provided the biggest boost, at 9.1% of cash flow from operations. Overall, the biggest drag on FCF came from capital expenditures. Body Central investors may also want to keep an eye on accounts receivable, because the TTM change is 2.3 times greater than the average swing over the past 5 fiscal years.

A Foolish final thought
Most investors don't keep tabs on their companies' cash flow. I think that's a mistake. If you take the time to read past the headlines and crack a filing now and then, you're in a much better position to spot potential trouble early. Better yet, you'll improve your odds of finding the underappreciated home-run stocks that provide the market's best returns.

Top 10 Gas Utility Stocks To Watch Right Now

Is Body Central the right retailer for your portfolio? Learn how to maximize your investment income and "Secure Your Future With 9 Rock-Solid Dividend Stocks," including one above-average retailing powerhouse. Click here for instant access to this free report.

We can help you keep tabs on your companies with My Watchlist, our free, personalized stock tracking service.

Add Body Central to My Watchlist.

Saturday, April 19, 2014

Google Is Crazy About Waze

There you have it: Following months of rumors about who would acquire Waze, the Israeli-based traffic data start-up, Google (NASDAQ: GOOG  ) has emerged the winner.

First, rumors swirled that Apple (NASDAQ: AAPL  ) was looking to acquire the company, which also happens to be one of the data partners to its controversial Maps app. Apple had already acquired three small mapping companies over the years to put together its service, so adding another one into the mix made some sense at the time.

The speculation turned out to be exactly that. At the All Things Digital conference last month, Kara Swisher bluntly asked CEO Tim Cook if Apple had made a bid for Waze. Apple has been on an acquisition spree recently, but Waze was never in the running, according to Cook.

The market then turned its attention to Facebook (NASDAQ: FB  ) , as the social network has no in-house mapping service and probably needs one if it hopes to compete meaningfully in local e-commerce. Facebook promptly hired the mapping manager that Apple fired, so mapping is certainly on its radar. As part of negotiations, Facebook had wanted Waze's team to move to its California headquarters, but Waze preferred to stay put in Israel. That's fine with Google, as Waze will stay in Israel and operate separately for the time being.

Google has now concluded the episode with a decisive acquisition, which may bolster its mapping lead over its rivals. Google Maps is already the undisputed mapping leader, and integrating smarter traffic data will further strengthen the search giant's position. Google just redesigned its web-based Maps platform last month.

Since Waze's service is crowd-sourced, it inherently benefits from network effects. Tapping into Google's vast user base that far exceeds the 47 million that Waze has will only make the service that much better. It's also possible that once Waze satisfies its contractual obligations with Apple, Google could preclude the Mac maker from accessing the data.

Big G hasn't confirmed how much it's paying, but the total could reach up to $1 billion. Will it be worth it?

As one of the most dominant Internet companies ever, Google has made a habit of driving strong returns for its shareholders. However, like many other web companies, it's also struggling to adapt to an increasingly mobile world. Despite gaining an enviable lead with its Android operating system, the market isn't sold. That's why it's more important than ever to understand each piece of Google's sprawling empire. In The Motley Fool's new premium research report on Google, we break down the risks and potential rewards for Google investors. Simply click here now to unlock your copy of this invaluable resource.

Thursday, April 17, 2014

10 Insurance Stocks to Sell Now

RSS Logo Portfolio Grader Popular Posts: 7 Biotechnology Stocks to Buy Now15 Oil and Gas Stocks to Sell Now6 Internet and Web Service Stocks to Buy Now Recent Posts: Hottest Healthcare Stocks Now – LCI LGND AGN ACT Biggest Movers in Technology Stocks Now – GRUB MDSO GTAT CSGP Hottest Financial Stocks Now – OAK BLK GNW CACC View All Posts

This week, the overall grades of 10 insurance stocks are lower, according to the Portfolio Grader database. Each of these rates a “D” (“sell”) or “F” overall (“strong sell”).

Cincinnati Financial Corporation () ratings are on the decline this week as the company earns an F (“strong sell”). Last week, it received a D (“sell”). Cincinnati Financial markets property casualty insurance through independent insurance agents. In Portfolio Grader’s specific subcategories of Earnings Momentum and Earnings Revisions, CINF also gets F’s. .

This week, Progressive Corporation () drops from a D to an F rating. Progressive is an insurance holding company that offers primarily personal and commercial automobile insurance, in addition to other property-casualty insurance products. .

Validus Holdings, Ltd. () is on the decline this week, earning a D (“sell”) after receiving a C (“hold”) last week. Validus Holdings provides reinsurance and insurance coverage in the property and marine markets. The stock also rates an F in Earnings Surprise. .

Axis Capital Holdings Limited () gets weaker ratings this week as last week’s C drops to a D. Axis Capital Holdings provides various insurance and reinsurance products to worldwide operations. .

The rating of Meadowbrook Insurance Group, Inc. () slips from a D to an F. Meadowbrook Insurance Group provides alternative risk management programs and services. The stock gets F’s in Earnings Revisions, Cash Flow and Sales Growth. .

Crawford & Company Class B’s () rating weakens this week, dropping to a D versus last week’s C. Crawford & Company is an independent provider of claims management solutions to insurance companies and self-insured entities. .

State Auto Financial Corporation () gets weaker ratings this week as last week’s C drops to a D. State Auto Financial is a property and casualty insurance company engaged in writing personal and business lines of insurance. The stock also gets an F in Earnings Momentum. .

This is a rough week for OneBeacon Insurance Group, Ltd. Class A (). The company’s rating falls to D from the previous week’s C. OneBeacon Insurance Group offers specialized insurance products and services. The stock also gets an F in Sales Growth. .

Erie Indemnity Company Class A () earns an F this week, falling from last week’s grade of D. Erie Indemnity is involved in the property/casualty insurance business. The stock also rates an F in Earnings Surprise. .

Aspen Insurance Holdings Limited () experiences a ratings drop this week, going from last week’s C to a D. Aspen Insurance Holdings provides insurance and reinsurance solutions worldwide. .

Louis Navellier’s proprietary Portfolio Grader stock ranking system assesses roughly 5,000 companies every week based on a number of fundamental and quantitative measures. Stocks are given a letter grade based on their results — with A being “strong buy,” and F being “strong sell.” Explore the tool here.

Tuesday, April 15, 2014

3 Blue Chips Climbing on Earnings (KO, JNJ, SCHW)

Twitter Logo LinkedIn Logo Google Plus Logo RSS Logo Dan Burrows Popular Posts: 5 Stocks to Buy in April5 High-Yield, Large-Cap Dividend Stocks to BuyPHOT Suspended by SEC – Sell Your Marijuana Stocks (While You Still Can) Recent Posts: 3 Blue Chips Climbing on Earnings (KO, JNJ, SCHW) The Top 10 S&P 500 Dividend Stocks for April HLF Stock: Herbalife Criminal Probe Makes Bill Ackman’s Day, But… View All Posts

First-quarter earnings season is supposed to be a dud, but don’t tell that to Coca-Cola (KO), Johnson & Johnson (JNJ) or Charles Schwab (SCHW). These three blue chips delivered some market-pleasing results Tuesday, helping KO stock, JNJ stock and SCHW stock to take off.

Dividend Increase 3 Blue Chips Climbing on Earnings (KO, JNJ, SCHW)Goodness knows the market can use the help. The S&P 500 looks to be working its way out of the April swoon, but heading into Tuesday it was up just 0.7% for the year-to-date.

The Dow Jones Industrial Average — of which JNJ and KO stock are constituents — is having an even rougher year. The blue-chip index was off 2.4% for the year before KO stock and JNJ stock rose after earnings.

Better-than-expected earnings of the type we saw from KO, JNJ and SCHW are the only hope for the S&P 500 if it’s to avoid a year-over-year decline in quarterly profits.

Analysts on average expect the broader market to post a 1.2% drop in first-quarter earnings, according to data from FactSet. That would be the first decrease in S&P 500 earnings since the third quarter of 2012.

Of course, not all of these names reported a year-over-year increase in net income. Right or wrong, the market doesn’t much care about that. Rather, it all comes down to adjusted earnings (which exclude things like one-time charges), and how those adjusted figures compare with expectations. That’s what’s driving KO stock, JNJ stock and SCHW stock after earnings.

Happily for anyone holding JNJ, SCHW stock or KO stock, the Street’s expectations were not disappointed. Here’s a look at the quarterly highlights for Coca-Cola, Johnson & Johnson and Schwab:

Coca-Cola (KO)

Coca-Cola has been having a rough time as people drink fewer carbonated beverages. Indeed, taste for fizzy drinks appears to be in secular decline. That’s a long-term threat to KO’s core business, and it’s already showing up in KO stock, which was down 3.6% for the year-to-date before Tuesday’s pop.

KO first-quarter profit fell more than 7% and revenue dropped 4%. So what’s the cheering about? Excluding charges, KO stock had earnings of 44 cents a share, which matched Wall Street’s forecast. Moreover, revenue of $10.58 billion exceeded analysts’ average projection.

In other good news for KO stock, global volume rose 2%, giving the market some hope that KO is building some momentum in a shrinking market for carbonated beverages. Another hopeful sign for KO stock is that revenue didn’t drop because of lower sales. Rather, it was all due to a stronger dollar. Strip out the effects of currency exchange, and KO would have had top-line growth of 2%.

No, it wasn’t a great quarter, but KO beat the Street’s low expectations, and that’s all it took to give KO stock some life.

Next Page

Johnson & Johnson (JNJ)

Johnson & Johnson is having an excellent year in a flat market. JNJ stock was up nearly 8% before it reported what Wall Street likes best: beat-and-raise earnings.

The wider pharmaceutical industry might be struggling with patent expirations on blockbuster drugs, but that’s not bothering JNJ or JNJ stock. Indeed, Johnson & Johnson’s first-quarter earnings rose 35%, driven by continued sales growth in JNJ’s pharmaceutical business.

Excluding special items like tax benefits and charges, earnings rose 7% to $1.54 a share, easily topping Street expectations of $1.47. Revenue expanded 3.5% to $18.1 billion, which also beat analysts’ average forecast.

Better-than-expected earnings and an ongoing cost-cutting program designed to slash $1 billion in expenses over three years helped JNJ raise its full-year outlook. JNJ now sees adjusted earnings coming in at $5.80 to $5.90 a share, up from a previous estimate of $5.75 to $5.85.

Results like this and JNJ’s strategic plan have the market bullish on JNJ stock. JNJ is in the process of dumping its slow-growth products and businesses — a move that should goose margins. JNJ stock also benefits from the cash the strategic plan puts in JNJ’s coffers. Late last month, JNJ sold its ortho-clinical diagnostics business for roughly $4 billion.

Charles Schwab (SCHW)

Charles Schwab said first-quarter profit rose by more than half, helped by higher trading commissions and fees for managing clients’ money. If SCHW can build on the solid results, SCHW stock might finally go somewhere.

SCHW stock is essentially flat for the year-to-date, but the latest quarterly results might just change the market’s sentiment on the discount brokerage. SCHW net income jumped 58% year-over-year, SCHW revenue increased 15%, and both numbers beat the Street’s expectations.

It looks like SCHW is finally getting a boost from the five-year bull market and stocks notching all-time highs — and that bodes well for SCHW stock. Retail investors have been wary of the stock market since the 2009 melt down, hurting commissions and fees at brokerages like SCHW. The latest results suggest that might be starting to change.

For the latest three-month period, SCHW saw trading revenue, asset-management and administration fees all rise 11%. Customer trading volume also rose 11%, to an average of 553,600 trades a day — the highest volume in SCHW history.

As of this writing, Dan Burrows did not hold a position in any of the aforementioned securities.

Monday, April 14, 2014

5 Best Telecom Stocks To Invest In 2014

5 Best Telecom Stocks To Invest In 2014: Chorus Ltd (CNU)

Chorus Limited maintains and builds a network made up of local telephone exchanges, cabinets and copper and fiber cables. The Company has approximately 32,000 kilometers of fiber and 130,000 kilometers of copper cabling. These cables connect back to local telephone exchanges. Chorus fiber also connects mobile phone towers owned by mobile service providers. About 7,000 cabinets provide interconnection points for around 50% of the lines in its network. A range of these cabinets are mini telephone exchanges and have electronic broadband equipment installed in them. In some cases, retail service providers have chosen to install their own broadband equipment in an exchange and pay the Company for the rental of the access line. It offers a range of products delivered over its copper network and new products designed to provide access to the ultra-fast broadband (UFB) fiber network. Advisors' Opinion:
  • [By Holly LaFon]

    Watsa sold two stocks in the fourth quarter: Continucare Corp. (CNU) and First Place Financial Corp. (FPFC). He reduced Dell (DELL), one of his largest holdings, but almost 60%.

  • source from Top Stocks Blog:http://www.topstocksblog.com/5-best-telecom-stocks-to-invest-in-2014.html

Sunday, April 13, 2014

America's least healthy cities

There's no doubt that great strides have been made in Americans' health over the years. Americans smoke less, are more likely to be insured and live longer. However, significant health disparities remain across the nation, influenced by individual choices, the community and clinical care.

To determine the well-being of Americans, Gallup-Healthways surveyed hundreds of thousands of Americans in 189 metropolitan areas in the United States in 2012 and 2013. The survey recorded the physical and emotional health of the residents, as well as measuring job satisfaction and access to basic needs. The resulting Gallup-Healthways Well-Being Index allows for comparisons between places and over time.

Not surprisingly, the physical health of residents was influenced by their habits. While less than 20% of Americans surveyed were smokers, more than 34% of Charleston, W.Va., residents smoked, the most in the nation. Residents also reported among the highest rates of obesity in the country.

In America's healthier areas, on the other hand, smoking rates tended to be much lower. San Jose had the second lowest smoking rate, with just around 11% of respondents reporting a smoking habit. Obesity rates in the areas were among the lowest.

According to Dan Witters, research director for the Gallup-Healthways Well-Being Index, there is a clear relationship between poor physical health outcomes, such as obesity, and many of these habits. "When you're talking about obesity, the big three are healthy eating, exercise, and smoking."

Having access to basic needs, such as medical care, medicines, food and shelter, also appeared to play a major role in determining the physical well-being of residents. Witters explained that "providing people with a safe place to exercise" obviously plays a role in regional obesity rates. Additionally, having a personal doctor "increases the probability that they'll have a trusted professional advising them about their healthy habits."

In addition to having access to ! basic needs, a healthy state of mind made a difference in the physical health of many area-residents. In fact, half of the metro areas with the best physical health index scores were also among the least likely to report recent bouts of depression. Emotional states such as anger, stress and sadness became much less common in areas with high physical health scores as well.

Survey participants who were "clinically diagnosed with depression had a significantly elevated probability of carrying around obesity," Witters said, as well as a variety of other chronic conditions.

Poverty and financial instability can make it very difficult to stay healthy. All but one of the 10 healthiest metro areas had poverty rates considerably lower than the national rate in 2012. Seven of the least healthy metro areas, on the other hand, had poverty rates exceeding the national rate. While access to healthy food has an impact on good nutrition, Witters pointed out that poverty played a greater role.

THE HEALTHIEST CITIES: Yes, 24/7 Wall St. has that list, too

Many components of staying healthy are learned. If people are poorly educated, they are less likely to know how best to care for themselves. Nine of the least healthy metro areas had college education attainment rates below the national rate. Residents of eight of the healthiest regions, conversely, were considerably more likely to have attained a bachelor's degree than Americans as a whole.

To identify the best and worst cities for physical health, 24/7 Wall St. reviewed the metropolitan areas with the best and worst scores on the Physical Health Index, part of the Gallup-Healthways Well-Being Index. The Gallup-Healthways Well-Being Index assessed 189 metropolitan statistical areas. The Physical Health Index is one of five subindices included in the groups' overall score. The index measures physical well-being for the United States, states, metropolitan areas and occupations, based on answers to a variety of questions. In addition to these! figures,! we also considered income, poverty and educational attainment data from the U.S. Census Bureau, all from 2012.

AMERICA'S LEAST HEALTHY CITIES:

10. Little Rock-North Little Rock-Conway, Ark.

> Physical Health Index: 72.2
> Obesity rate: 35.1% (5th highest)
> Blood pressure: 37.8% (5th highest)
> Poverty rate: 15.1% (134th lowest)

Unhealthy behaviors may help explain the poor physical health of Little Rock area's residents. Just 56.4% of respondents told Gallup they ate healthy all day the previous 24 hours, the worst rate nationwide. Additionally, more than one-quarter of survey respondents were smokers, compared with less than 20% of Americans nationwide. Although Little Rock residents were more likely than most Americans to exercise, more than 35% were classified as clinically obese in 2013, among the largest proportions in the country. A high obesity rate may have contributed to other health issues inflicting area residents. More than 37% of survey respondents had been told by a medical practitioner that they had high blood pressure, worse than all but four other metro areas.

MORE: Ten cities where people can't find work

9. Spartanburg, S.C.

> Physical Health Index: 71.9
> Obesity rate: 30.0% (34th highest)
> Blood pressure: 36.3% (10th highest)
> Poverty rate: 20.0% (70th highest)

More than 30% of Spartanburg residents surveyed told Gallup they were unable to participate in age appropriate activities due to their health. This was one of the highest rates in the nation and one of a number of physical health problems that plagued residents. Even worse, 36.3% of respondents said they had high blood pressure, 13.7% said they had been diagnosed with diabetes and nearly 6% said they had previously suffered a heart attack — all among the worst rates in the nation. One contributing factor may be people's unhealthy behaviors. Less than 48% of respondents exercised regularly, among the lowest rates in the nation. Also! , 27.5% o! f people stated they smoked, one of the highest rates in America.

MORE: Cities with the most content (and miserable) workers

8. Chattanooga, Tenn.-Ga.

> Physical Health Index: 71.7
> Obesity rate: 29.7% (40th highest)
> Blood pressure: 35.7% (14th highest)
> Poverty rate: 15.8% (164th lowest)

Less than 80% of respondents living in the Chattanooga metro area said they had enough energy to accomplish what they needed to the day before, worse than all but two other metro areas. Also, nearly 31% of respondents had health problems that hindered their ability to participate in age appropriate activities. Low incomes in the region may be contributing to the poor physical health of residents — median household income was just $43,475 in 2012, considerably lower than the national median of $51,371 that year. Low incomes may have limited Chattanooga-area residents' ability to access basic needs, such as health care, which in turn may have also contributed to poor physical health. While the percentage of area residents covered by health insurance was inline with the national rate, just three-quarters of respondents said they had enough money for health care and medicine, among the lowest rates nationwide.

MORE: America's most content (and miserable) cities

7. Clarksville, Tenn.-Ky.

> Physical Health Index: 71.6
> Obesity rate: 33.8% (8th highest)
> Blood pressure: 29.3% (92nd highest)
> Poverty rate: 19.3% (93rd highest)

Clarksville-area residents were among the nation's most likely to be obese, with 33.8% considered obese based on their height and weight. Residents were also exceptionally likely to report recurring pains, with more than 37% stating they suffered from neck or back pain and more than 35% stating they suffered from leg or knee pain, both among the highest rates in the country. Residents' poor health was not just limited to physical ailments. People in the Clarksville area were more likely than Americans in ! most metr! o areas to have felt angry and among the least likely to have felt happy within the previous day. Both measures are important components of emotional health, for which Clarksville was among the worst rated metro areas in the nation.

MORE: Nine cities where wealth is soaring

6. Fort Smith, Ark.-Okla.

> Physical Health Index: 71.4
> Obesity rate: 29.8% (38th highest)
> Blood pressure: 35.4% (16th highest)
> Poverty rate: 22.6% (32nd highest)

Like most metro areas with poor physical health scores, health issues prevented many Fort Smith residents from participating in age-appropriate activities. Nearly 35% of survey respondents said health problems prevented them from performing activities people their age normally perform, worst among all areas surveyed. Chronic pain was likely an obstacle to usual activities for many residents. Nearly 40% of respondents reported recurring neck or back pains, second worst nationwide. In addition to poor health, residents suffered from poor economic conditions. Median household income was just $36,061 in 2012, among the lowest in the nation. Further, more than 22% were living in poverty that year, also among the worst rates in the United States.

MORE: America's most (and least) literate cities

5. Redding, Calif.

> Physical Health Index: 71.4
> Obesity rate: 27.6% (82nd highest)
> Blood pressure: 30.1% (78th highest)
> Poverty rate: 16.6% (166th highest)

Nearly a third of Redding area respondents said health problems prevented them from participating in age-appropriate activities, and 36.9% said their health kept them from their usual routines. Both rates were among the highest in the nation. Recurring pain was a common problem for many respondents, but even worse, 10.7% of those surveyed said they had previously been diagnosed with cancer, one of the highest rates in the nation. Drug use has also been a major health issue in the area. Shasta County, which makes up the Redding metro ! area, is ! considered part of the Central Valley High Intensity Drug Trafficking Area, and use of hard drugs such as methamphetamine has been cited as a problem in the county.

MORE: Cities with highest (and lowest) taxes

4. Columbus, Ga.-Ala.

> Physical Health Index: 70.7
> Obesity rate: 32.5% (13th highest)
> Blood pressure: 32.8% (36th highest)
> Poverty rate: 18.7% (102nd highest)

Individuals in the Columbus metro area were among the nation's most likely to suffer from recurring pain and a lack of energy. Only 68.2% said their health allowed them to take part in age-appropriate activities, one of the lowest rates in the nation. Columbus residents were among the least likely to eat healthy on a daily basis. Less than 60% of survey respondents said they ate healthy all day the previous day, worse than all but two metro areas reviewed. Financial constraints explain poor eating habits more than any other factor. More than 20% of residents were on food stamps in 2012, and just 67.1% of residents told Gallup they were able to afford food at all times the year before — among the worst rate in the nation. By comparison, 80.9% of Americans reported sufficient resources for food.

3. Kingsport-Bristol-Bristol, Tenn.-Va.

> Physical Health Index: 70.5
> Obesity rate: 30.9% (25th highest)
> Blood pressure: 40.6% (3rd highest)
> Poverty rate: 16.4% (176th highest)

Kingsport area residents suffered from a variety of health issues the past few years, including chronic pain and heart problems. More than 31% of respondents reported recurring knee and leg pain, and 40.6% complained of high blood pressure, both among the nation's worst rates. The region's health concerns may be tied to low rates of educational attainment and low incomes. Less than 20% of Kingsport area adults had at least a bachelor's degree in 2012, a considerably lower rate than the nearly 30% of Americans with at least a bachelor's degree. The area was also not particularly we! althy. A ! typical family in the Kingsport metro area earned just $37,769 in 2012, among the lowest median incomes nationwide.

MORE: The best (and worst) paying cities for women

2. Charleston, W.Va.

> Physical Health Index: 69.0
> Obesity rate: 34.6% (6th highest)
> Blood pressure: 45.4% (2nd highest)
> Poverty rate: 15.0% (130th lowest)

Fewer survey respondents from Charleston said they were well-rested and had enough energy to go about their day during the previous day than those in all but one other metro area. Just two-thirds of respondents said health problems did not prevent them from participating in age-appropriate activities, second worst among all areas reviewed. Poor behaviors may have played a role in respondents' poor physical health. Area residents had the highest smoking rate in the country, with more than one-third reporting a smoking habit. Poor emotional health can often be associated with poor physical health as well, and people in Charleston did not fare well on emotional health measures either. For example, only 52.1% of respondents said they learned something new or interesting in the previous 24 hours, less than any other metro area reviewed.

MORE: Ten U.S. cities where violent crime is soaring

1. Huntington-Ashland, W.Va.-Ky.-Ohio

> Physical Health Index: 66.2
> Obesity rate: 39.5% (the highest)
> Blood pressure: 46.9% (the highest)|
> Poverty rate: 18.3% (111th highest)

No metro area rated worse than Huntington for physical health. Nearly 40% of area residents were considered obese, the most of any metro area reviewed. Additionally, nearly 47% of residents had high blood pressure and 34.4% had been diagnosed as having high cholesterol, the highest rates of any metro area. Residents also were among the most likely Americans to suffer serious health consequences. Nearly 10% had previously suffered a heart attack, again worse than any metro area. Additionally, 12.5% of the population had been diagnosed! with can! cer, third most in the nation. Poor healthy behaviors, such as high smoking rates and limited exercise, may have been contributing factors to residents' poor health. Additionally, limited access to basic needs, such as health care and medicine, may have also played a role.

24/7 Wall St. is a USA TODAY content partner offering financial news and commentary. Its content is produced independently of USA TODAY.