BALTIMORE (Stockpickr) -- It's cold on Wall Street this month, both literally and figuratively. Lows are reaching single digits in the Northeast as I write today, but the S&P 500 is positively sub-zero three full weeks into 2014.
>>5 Shareholder Yield Winners to Beat the S&P 500
At last count, the big index is down around 0.24%. Even though equities aren't quite hemorrhaging points this winter, they are giving investors the cold shoulder. And that's precisely why it makes sense to focus on strength as we head into the final trading week of January.
To do that, we're turning to the charts to take a closer look at the technical trading setups in five of Wall Street's biggest names.
If you're new to technical analysis, here's the executive summary.
Technicals are a study of the market itself. Since the market is ultimately the only mechanism that determines a stock's price, technical analysis is a valuable tool even in the roughest of trading conditions. Technical charts are used every day by proprietary trading floors, Wall Street's biggest financial firms, and individual investors to get an edge on the market. And research shows that skilled technical traders can bank gains as much as 90% of the time.
>>5 Sin Stocks to Play for Defense in 2014
Every week, I take an in-depth look at big names that are telling important technical stories. Here's this week's look at five high-volume stocks to trade this week.
SPDR S&P 500 ETF
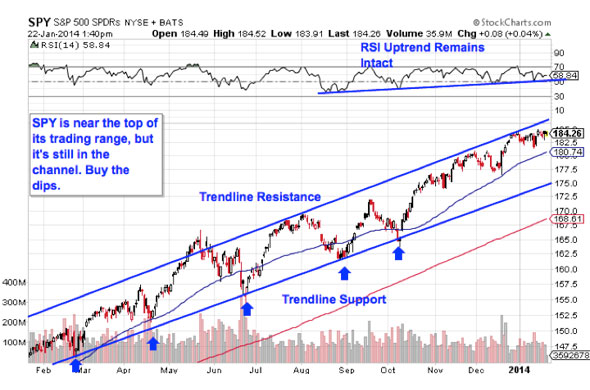
It makes sense to start off with a look at the broad market. To do that, we'll use the SPDR S&P 500 ETF (SPY), the best investible proxy for everyone's favorite stock index. Despite all of the anxiety that's been pumped into stocks over the course of the last month, SPY doesn't look half bad as we head deeper into 2014.
>>5 Stocks Insiders Love Right Now
That's because SPY is still staying within the uptrending channel that's been in force since before the start of 2013. So, sure, SPY may be correcting this month, but it's a correction within the context of a longer-term rally. That's shouldn't scare investors away from buying stocks -- it should encourage them!
We're still very much in a "buy the dips" kind of market. On each successive test of trendline support since all the way back in late 2012, the S&P has managed to catch a bid and bounce higher. Odds look pretty good that history will repeat itself on the next attempt; but all trendlines do eventually break, which is why it's critical to wait for shares to actually bounce off of support before diving in.
It's worth noting that momentum, measured by 14-day RSI, is still very much in "bull" mode right now. The S&P could still stand to fall quite a bit without breaking the uptrend in stocks – and if shares come down to test trendline support sometime soon (either with a meaningful move lower or a sideways time correction), I'd certainly be a buyer.
Amazon.com
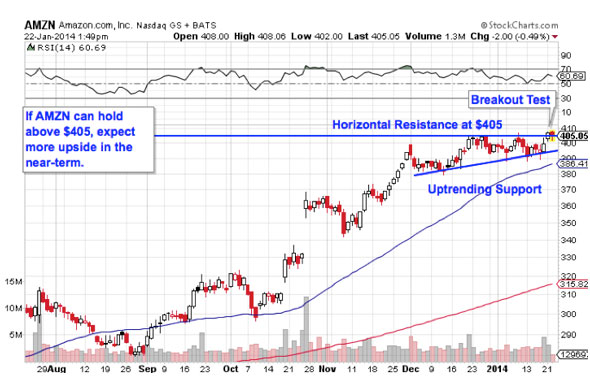
It's been a pretty solid year for shareholders of Amazon.com (AMZN). In the last 12 months, the online retail behemoth has seen its shares rally more than 48.7%. Don't worry if you missed the move, though -- the recent price action in Amazon points to move highs on the way. Here's how to trade it:
>>4 Tech Stocks in Breakout Territory
Amazon.com is currently forming an ascending triangle pattern, a bullish setup that's formed by a horizontal resistance level above shares at $405 and uptrending support to the downside. Basically, as AMZN bounces in between those two technical price levels, it's getting squeezed closer and closer to a breakout above $405. When that happens, we've got our buy signal -- and shares are testing that breakout in this morning's session...
Whenever you're looking at any technical price pattern, it's critical to think in terms of buyers and sellers. Triangles and other price pattern names are a good quick way to explain what's going on in this stock, but they're not the reason it's tradable. Instead, it all comes down to supply and demand for shares.
That resistance line at $405 is a price where there's an excess of supply of shares; in other words, it's a place where sellers have been more eager to take recent gains and sell their shares than buyers have been to buy. That's what makes the move above it so significant -- a breakout indicates that buyers are finally strong enough to absorb all of the excess supply above that price level. If shares can hold $405 in today's session, it's time to click "buy."
Apple
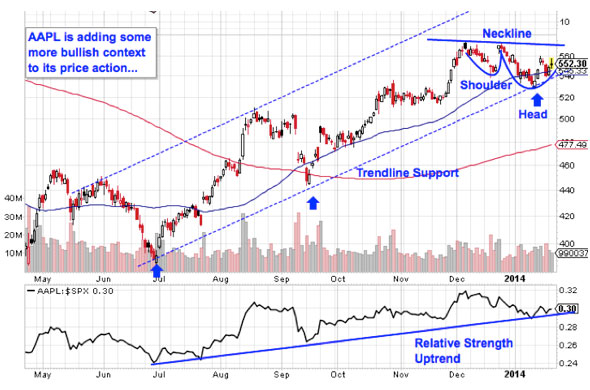
Apple (AAPL) is another name that looks stellar from a technical standpoint right now. Shares of the technology giant have been in an uptrend since July, but it's the setup forming within the uptrend that makes AAPL look especially timely in January. It's all thanks to an inverse head and shoulders that's taking shape in the short-term.
>>2 Oversold Stocks Ready to Bounce Higher
The inverse head and shoulders pattern in a bullish price setup that indicates exhaustion among sellers. After the 40% that shares of Apple have climbed since July, it's not too hard to see why sellers might be getting tired. The pattern is formed by two swing lows that bottom out around the same level (the shoulders), separated by a deeper low (the head). The buy signal comes on a move through the neckline, which is right at $570.
What's perhaps most important in AAPL right now is relative strength. With the S&P sitting in corrective mode, relative strength is the single most important technical indicator you can put in your toolbox; it's what will keep your portfolio from buckling under the weight of a correction.
With Apple stomping the S&P for more than six months now, relative strength couldn't look much better -- and that adds a lot of confidence for a buy on a move above $570. Risk-averse traders may want to consider a protective stop at the 50-day moving average.
BHP Billiton
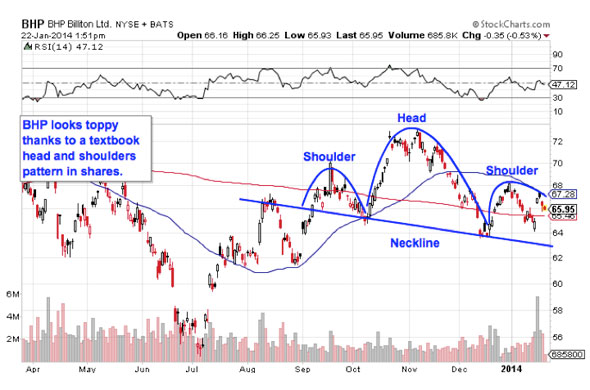
Not all of this week's trades are bullish, but often, knowing which names to sidestep (or which to actively short) is what keeps you alive when market performance turns anemic. That brings us to BHP Billiton (BHP), a mega-cap resource stock that's forming the bearish opposite to the one in Apple.
>>5 Stocks Set to Soar on Bullish Earnings
Worse, BHP's head and shoulders top is forming in the long-term; what comes with long-term downside implications if it triggers.
BHP's neckline is right at $62.50 right now, but it's downsloping. For that reason, it'll continue to drop the longer BHP takes to approach it. The biggest problem for anyone who owns BHP right now is that any sell signal is going to be late -- but it'll also be worth heeding considering this stock's previous reactions to this pattern. On multiple timeframes, head and shoulders setups have had little trouble meeting their price targets in BHP this past year.
For longs waiting to buy, I'd recommend avoiding shares unless BHP can break above its right shoulder at $68. Otherwise, if the head and shoulders does trigger, $56 looks like the closest support level for shares to catch a bid again.
Exxon Mobil
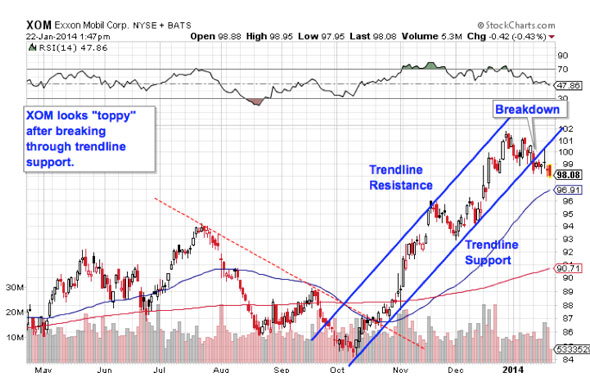
Last up is Exxon Mobil (XOM). This oil and gas supermajor needs to introduction, but its chart does. Exxon is bookending our list of trades opposite SPY because it's showing traders what happens when a good uptrend setup goes bad.
Exxon broke a downtrend at the end of 2013, initiating a well-defined rally that started in October. But the uptrend in Exxon was steep enough that it wasn't likely to last for long, and the breakdown below trendline support last week proves it. That move, incidentally, is precisely why it's crucial to wait for a bounce off of support before buying a stock that's pulling back. Exxon couldn't catch a bid at support anymore, and shares fell through.
From here, more downside looks likely. While $95 looks like a reasonable place for shares to find support in the near-term, not losing much money isn't exactly a viable strategy for 2014. Instead, focus on the names with better relative strength in this market.
To see this week's trades in action, check out this week's Must-See Charts portfolio on Stockpickr.
-- Written by Jonas Elmerraji in Baltimore.
RELATED LINKS:
>>5 Health Care Stocks to Trade for Gains
>>5 Rocket Stocks to Buy for a Short Trading Week
>>5 Stocks Ready to Break Out
Follow Stockpickr on Twitter and become a fan on Facebook.
At the time of publication, author was long AAPL.
Jonas Elmerraji, CMT, is a senior market analyst at Agora Financial in Baltimore and a contributor to
TheStreet. Before that, he managed a portfolio of stocks for an investment advisory returned 15% in 2008. He has been featured in Forbes , Investor's Business Daily, and on CNBC.com. Jonas holds a degree in financial economics from UMBC and the Chartered Market Technician designation.Follow Jonas on Twitter @JonasElmerraji
No comments:
Post a Comment